Graphing a Linear Equation
Related Pages
More Algebra Lessons
More Geometry Lessons
Algebra Worksheets
Algebra Games
There are several methods to graph a linear equation.
The following diagrams show the different methods to graph a linear equation. Scroll down the page for more examples and solutions.

Printable & Online Coordinate Geometry Worksheets
In these lessons, we will learn
- how to graph linear equations by plotting points. Click here
- how to graph linear equations by finding the x-intercept and y-intercept. Click here
- how to graph linear equations using the slope and y-intercept. Click here
Graph Linear Equations by Plotting Points
It takes only 2 points to draw a graph of a straight line. In other words, if we can find two points that satisfies the equation of the line, then the line can be accurately drawn. (You may plot more than two points to check)
Example:
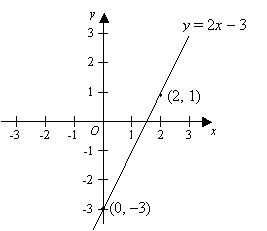
Draw the line with equation y = 2x – 3
Solution:
Choose any value for x and substitute into the equation to get the corresponding value for y. If possible, try to choose values of x that will give whole numbers for y to make it easier to plot.
Step 1: Let x = 0
y = 2(0) – 3
y = – 3
Step 2: Let x = 2
y = 2(2) – 3
y = 1
Step 3: Plot the two points on the Cartesian plane
Step 4: Draw a straight line passing through the two points

How to use a t-table to graph linear equations?
Example:
Graph the line for
a) y = 2x - 4
b) y = -1/2 x + 2
How to graph a linear equation by plotting points?
Example:
Graph the line
3x + 6y = 18
Graph Linear Equations by using X and Y Intercepts
The x-intercept is where the line crosses the x-axis. At this point, the y-coordinate is 0.
The y-intercept is where the line crosses the y-axis. At this point, the x-coordinate is 0.
When an equation is written in general form it is easier to graph the equation by finding the intercepts.
Step 1: Find the x-intercept, let y = 0 then substitute 0 for y in the equation and solve for x
Step 2: Find the y-intercept, let x = 0 then substitute 0 for x in the equation and solve for y
Step 3: Plot the intercepts, label each point, and draw a straight line through these points.
How to find intercepts and use intercepts to graph linear equation?
Examples:
- Find the intercepts of
3x + y = 6 - Graph x - y = 5
- Find the intercepts and graph.
- Plot the points and graph.
How to graph Linear Functions by finding the X-Intercept and Y-Intercept of the Function?
Examples:
- Graph 2x + 4y = 12
- Graph 3x - 2y = 8
Graph Linear Equations using Slope-Intercept
We can use the slope and y-intercept to graph a linear equation.
The slope-intercept form of an equation is
y = mx + b, where m is the slope of the line and b is the y-intercept.
How to graph an equation given in slope-intercept form?
Step 1: Find the y-intercept and plot the point.
Step 2: From the y-intercept, use the slope to find the second point and plot it.
Step 3: Draw a line to connect the two points.
What is the slope intercept formula and how to graph the equation?
Example:
Graph
a) y = 2x + 3
b) y = -2/3x - 2
How to graph a linear equation given in slope intercept form?
The equation y = mx + b is called the slope-intercept form of a line.
The equation represents a line where
m = slope
b = y-intercept (0, b)
Example:
Identify the slope and y-intercept. Graph.
a) y = -2/3 x + 1
b) y = 5x - 2
c) y = x
d) 3x - 2y = 8
Try the free Mathway calculator and
problem solver below to practice various math topics. Try the given examples, or type in your own
problem and check your answer with the step-by-step explanations.

We welcome your feedback, comments and questions about this site or page. Please submit your feedback or enquiries via our Feedback page.