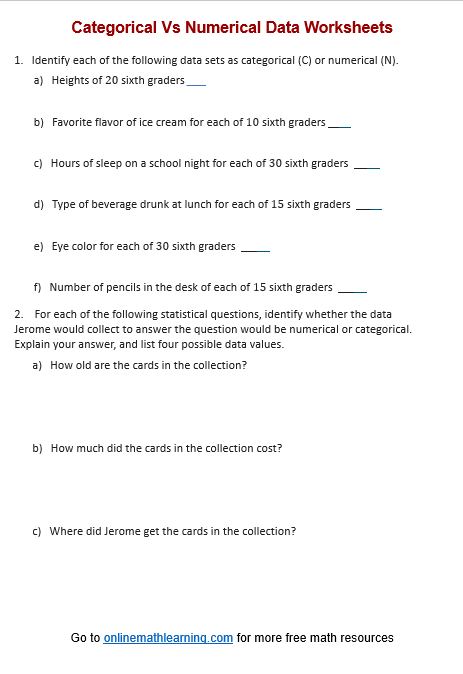
Categorical vs Numerical Data Worksheet
Related Topics:
More Grade 6 Math Lessons
Free Math Worksheets
Free Printable Worksheets
Printable “Statistics” Worksheets:
Statistical Questions
Categorical vs. Numerical Data
Free printable and online worksheets to help Grade 6 students review how to distinguish between categorical data and numerical data.
What are Categorical Data vs Numerical Data?
In statistics, data can be classified into two main types: categorical data and numerical data. Each type has specific characteristics and is analyzed using different methods. Here’s an overview of both:
Categorical Data
Categorical data represents characteristics or qualities that can be used to group individual data points into categories. These categories are typically names or labels, and the data can be either nominal or ordinal.
Types:
Nominal Data:
Categories that have no inherent order or ranking.
Examples: Gender (male, female, other), Blood type (A, B, AB, O), Marital status (single, married, divorced).
Ordinal Data:
Categories that have a specific order or ranking, but the differences between categories are not uniform.
Examples: Education level (high school, bachelor’s, master’s, PhD), Customer satisfaction (satisfied, neutral, dissatisfied).
Characteristics:
Cannot be measured numerically but can be counted.
Often represented using bar charts, pie charts, or frequency tables.
Used for qualitative analysis.
Numerical Data
Numerical data represents measurable quantities and can be subjected to arithmetic operations. This type of data can be either discrete or continuous.
Types:
Discrete Data:
Countable values that typically represent whole numbers.
Examples: Number of students in a class, number of cars in a parking lot, number of goals scored in a match.
Continuous Data:
Measurable values that can take on any value within a range and can include fractions and decimals.
Examples: Height, weight, temperature, time, distance.
Characteristics:
Can be measured and ordered.
Often represented using histograms, line graphs, box plots, or scatter plots.
Used for quantitative analysis.
Summary
Understanding the distinction between categorical and numerical data is crucial for proper data analysis. Categorical data helps classify and group information, while numerical data allows for calculations and comparisons using mathematical operations. By recognizing the type of data you’re dealing with, you can choose the most appropriate statistical methods to draw meaningful insights from your data.
Have a look at this video if you need to review how to distinguish between categorical (nominal & ordinal) and numerical (discrete & continuous) data.
Click on the following worksheet to get a printable pdf document.
Scroll down the page for more Categorical vs Numerical Data Worksheets.
More Categorical vs Numerical Data Worksheets
Printable
(Answers on the second page.)
Categorical vs Numerical Data Worksheet #1
Categorical vs Numerical Data Worksheet #2
Related Lessons & Worksheets
Try the free Mathway calculator and
problem solver below to practice various math topics. Try the given examples, or type in your own
problem and check your answer with the step-by-step explanations.

We welcome your feedback, comments and questions about this site or page. Please submit your feedback or enquiries via our Feedback page.
