Central Tendency & Variance (Grade 6)
Video lessons, examples and solutions to help Grade 6 students learn how to recognize that a measure of center for a numerical data set summarizes all of its values with a single number, while a measure of variation describes how its values vary with a single number.
Related Topics:
Grade 6 Math Lessons
Common Core Grade 6
Common Core: 6.SP.3
Suggested Learning Targets
- I can recognize there are measures of central tendency for a data set, e.g., mean, median, mode.
- I can recognize there are measures of variances for a data set , e.g., range, interquartile range, mean absolute deviation.
- I can recognize that measure of central tendency for a data set summarizes the data with a single number.
- I can recognize that measures of variation for a data set describe how its values vary with a single number.
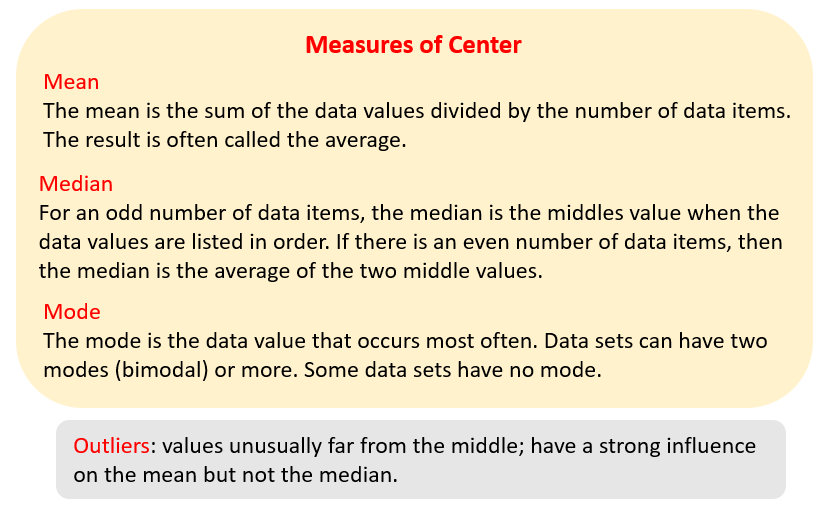
The following figures show the Measures of Central Tendency: Median, Mean, Mode. Scroll down the page for more examples and solutions.

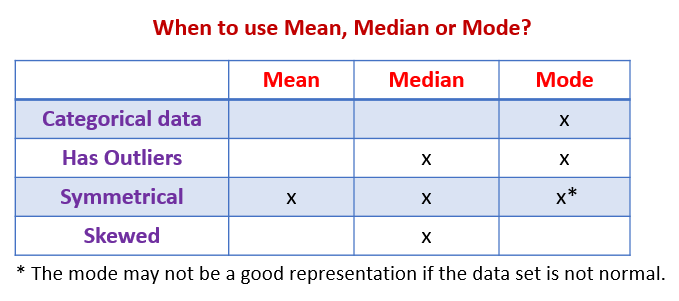
The following table summarizes when to use Median, Mean, or Mode. Scroll down the page for more examples and solutions.

Measures of Central Tendency and Spread for One Variable Data
Use statistics appropriate to the shape of the data distribution to compare center (median, mean) and spread (interquartile range, standard deviation) of two or more different data sets.
Choosing the Best Measure of Central Tendency
An outlier is a data value that is distinctly separate from the rest of the data.
Example:
Find an outlier in the data and tell how it affects the mean.
11,14,9,1,12,15,12,13
Which is the best measure of central tendency?
Mode: When the data is not numerical.
Median: When there may be outliers.
Mean: When there are no outliers.
Example:
Distance traveled in miles to visit relatives during winter break: 210,45,10,108,452,225,35,95,140,25,65,250.
- Find the mean and median of the data set.
- Identify if there are any outliers.
- If there is am outlier, find the mean and median without the outlier.
- If there is an outlier, how was the mean affected by removing the outlier?
Central Tendency
Quick review on mean, median, mode,range, outliers.
Measures of Central Tendency
This video takes a deeper look at whether the mean, median, or mode should be used to describe a set of data. Which one is better?
Mean Absolute Deviation
- Find the mean of the data.
- Find the distance of each data point from the mean.
- Find the mean of the distances.
Mean Absolute Deviation
Review how to find the MAD or mean absolute deviation of a given data set.
- Find the mean of the given data set
- Find the distance that each element in your data set is away from the mean.
- Calculate the mean of the distances.
Try the free Mathway calculator and
problem solver below to practice various math topics. Try the given examples, or type in your own
problem and check your answer with the step-by-step explanations.

We welcome your feedback, comments and questions about this site or page. Please submit your feedback or enquiries via our Feedback page.