Complex Numbers - Argand Diagram
Related Pages
Complex Numbers
The Real Number System
More Lessons for A Level Maths
Math Worksheets
These lessons, with videos, examples and solutions, help A Level Maths learn what complex numbers are and their properties.
What is an Argand Diagram?
An Argand diagram is a graphical way to represent complex numbers on a 2D plane, where:
- The x-axis (horizontal) shows the real part of the number.
- The y-axis (vertical) shows the imaginary part.
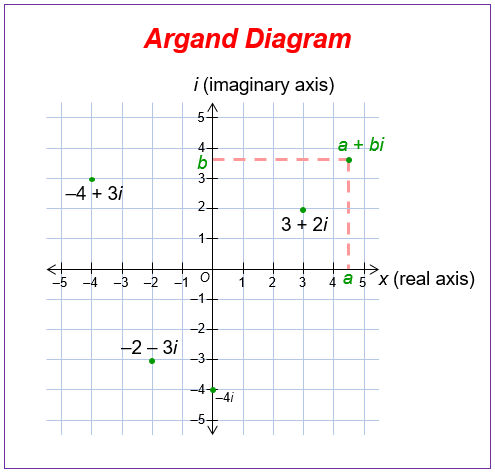
An Argand Diagram is a plot of complex numbers as points on the complex plane or Argand plane. The complex number z = x + yi is plotted as the point (x, y), where the real part is plotted in the horizontal axis and the imaginary part is plotted in the vertical axis.
The following diagram shows how complex numbers can be plotted on an Argand Diagram. Scroll down the page for more examples and solutions.

Complex Numbers Worksheets
Practice your skills with the following complex numbers worksheets:
Online & Printable Complex Numbers Worksheets
Key Features of an Argand Diagram
- Axes:
- Horizontal Axis (Real Axis): This axis represents the real part of a complex number. Just like the x-axis in a Cartesian plane, values to the right of the origin are positive real numbers, and values to the left are negative real numbers.
- Vertical Axis (Imaginary Axis): This axis represents the imaginary part of a complex number. Just like the y-axis, values above the origin are positive imaginary numbers (multiples of the imaginary unit (i)), and values below are negative imaginary numbers.
- Plotting Complex Numbers:
- A complex number (z = a + bi), where (a) is the real part and (b) is the imaginary part, is plotted as a point with coordinates ((a, b)) on the Argand diagram.
- The real part (a) determines the horizontal position, and the imaginary part (b) determines the vertical position.
FP1 Complex Numbers (Edexcel Further Pure Maths)
Argand Diagram Plotting
How to Represent Numbers on an Argand Diagram?
Basic complex analysis | Imaginary and complex numbers
Argand Diagram, magnitude, modulus, argument, exponential form
Try out our new and fun Fraction Concoction Game.
Add and subtract fractions to make exciting fraction concoctions following a recipe. There are four levels of difficulty: Easy, medium, hard and insane. Practice the basics of fraction addition and subtraction or challenge yourself with the insane level.

We welcome your feedback, comments and questions about this site or page. Please submit your feedback or enquiries via our Feedback page.