In these lessons, we will look at graphing the cosine function and properties of the cosine function.
We will start with the unit circle.
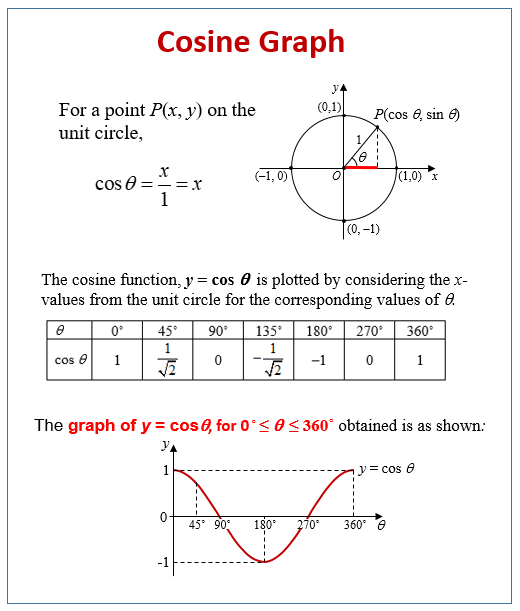
A unit circle is a circle of radius one unit with its center at the origin.
The following diagram shows the unit circle and the cosine graph. Scroll down the page for more examples and solutions on how to graph the cosine function.

Trigonometry Worksheets
Practice your Trigonometry skills with the following worksheets:
Printable & Online Trigonometry Worksheets
Properties of the cosine function:
- The cosine function forms a wave that starts from the point (0,1)
- cos θ = 0 when θ = 90˚, 270˚.
- Maximum value of cos θ is 1 when θ = 0˚, 360˚. Minimum value of cos θ is –1 when θ = 180˚. So, the range of values of cos θ is – 1 ≤ cos θ ≤ 1.
- As the point P moves round the circle in either the clockwise or anticlockwise direction, the cosine curve above repeats itself for every interval of 360˚. Its period is 360˚ (2π).

Peaks: At x = 0, 2π, 4π,… (cos x = 1).
Troughs: At x = π, 3π,… (cos x = -1).
Zeros: At \(x = \frac{π}{2}, \frac{3π}{2},\) ,… (cos x = 0).
Example:
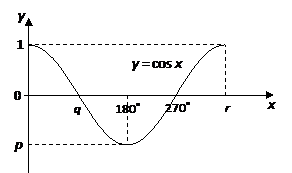
The diagram shows a graph of y = cos x for 0° ≤ x ≤ 360°, determine the values of p, q and r.

Solution:
We know that cos 180˚ = –1. So, p = –1.
We know that for a cosine graph, cos θ = 0 for θ = 90˚ and 270˚. So, θ = 90˚
We know that for a cosine graph, cos θ = 1 for θ = 0˚ and 360˚.
So, r = 360˚
Example:
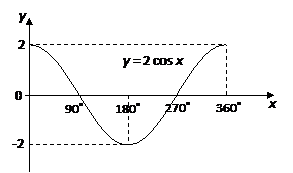
Sketch the graph of y = 2 cos x for 0˚ ≤ x ≤ 360˚.
Solution:
Set up a table of values for the equation y = 2cos x
| x | 0 |
90 |
180 |
270 |
360 |
cos x |
1 |
0 |
–1 |
0 |
1 |
2 cos x |
2 |
0 |
–2 |
0 |
2 |
Plot the points and join with a smooth curve.

Also take note that, the graphs of y = sin x and y = cos x, for 0˚ ≤ x ≤ 360˚, intersect at two points: x = 45˚ and x = 225˚.

How to graph basic sine and cosine functions (in degrees)?
The Graph of Cosine, y = cos (x)
Try out our new and fun Fraction Concoction Game.
Add and subtract fractions to make exciting fraction concoctions following a recipe. There are four levels of difficulty: Easy, medium, hard and insane. Practice the basics of fraction addition and subtraction or challenge yourself with the insane level.

We welcome your feedback, comments and questions about this site or page. Please submit your feedback or enquiries via our Feedback page.