Create Dot Plots Worksheet
Related Topics:
More Grade 6 Math Lessons
Free Math Worksheets
Free Printable Worksheets
Printable “Statistics” Worksheets:
Statistical Questions
Categorical vs. Numerical Data
Create Dot Plots
Interpret Dot Plots
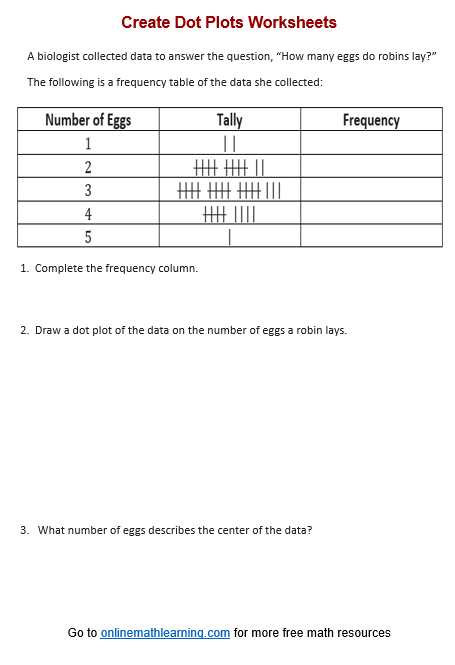
Free printable and online worksheets to help Grade 6 students review how to create a dot plot of a given data set. Summarize a given data set, construct a frequency table and describe the distribution.
Create Dot Plots
A dot plot is a simple yet effective way to visualize the distribution of a dataset, especially for small to moderate-sized sets of numerical data. It shows individual data points plotted along a number line, making it easy to see the frequency and spread of values.
Steps to Create a Dot Plot
- Collect and Organize Data:
Gather the data you want to visualize. - Draw a Number Line:
Draw a horizontal line and mark it with evenly spaced intervals covering the range of your data values. - Plot the Data Points:
For each data point in your dataset, place a dot above the corresponding value on the number line.
If a value appears multiple times, stack the dots vertically above that value.
Have a look at this video if you need to review how to create a dot plot.
Click on the following worksheet to get a printable pdf document.
Scroll down the page for more Create Dot Plots Worksheets.
More Create Dot Plots Worksheets
Printable
(Answers on the second page.)
Create Dot Plots Worksheet #1
Create Dot Plots Worksheet #2
Related Lessons & Worksheets
Try out our new and fun Fraction Concoction Game.
Add and subtract fractions to make exciting fraction concoctions following a recipe. There are four levels of difficulty: Easy, medium, hard and insane. Practice the basics of fraction addition and subtraction or challenge yourself with the insane level.

We welcome your feedback, comments and questions about this site or page. Please submit your feedback or enquiries via our Feedback page.
