Data Distribution (Grade 6)
Examples, solutions, videos, and lessons to help Grade 6 students understand that a set of data collected to answer a statistical question has a distribution which can be described by its center, spread, and overall shape.
Related Topics: Grade 6 Math Lessons
Common Core Grade 6
Common Core: 6.SP.2
Suggested Learning Targets
- I can identify that a set of data has distribution.
- I can describe a set of data by its center, e.g., mean and median.
- I can describe a set of data by its spread and overall shape, e.g. by identifying data clusters, peaks, gaps and symmetry.
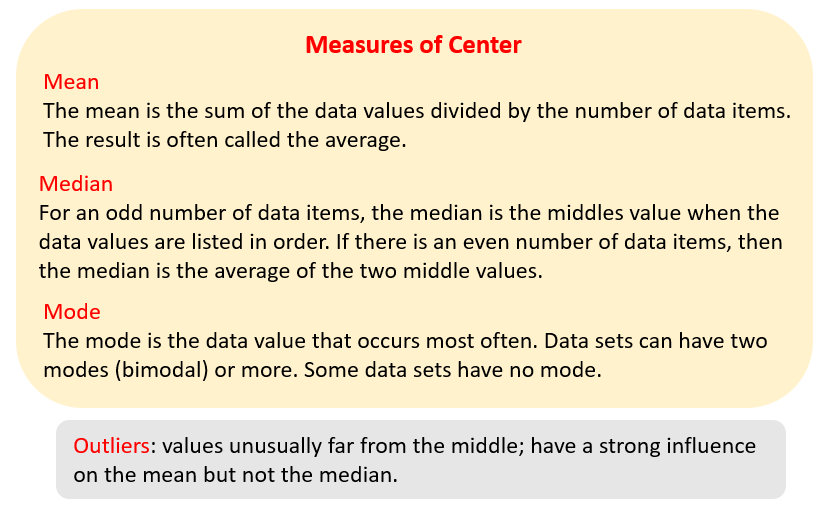
The following figures describe the measures of center: Mean, median, mode. Scroll down the page for examples and solutions.

Data Distribution Descriptions
Measuring the center and measuring variability
Median and Mode
In this lesson you will learn how to describe the distribution of data by using the range.
Examples:
- The table shows the number of monkeys at eleven different zoos. Find the median and mode of the data.
28,36,18,25,12,44,18,42,34,16,30 - Dina recorded her scores on 7 tests in the table. Find the median an mode of the data.
93,88,94,93,85,97,90 - Find the median and mode of the temperatures displayed in the graph.
- Miguel researched the average precipitation in several states. Find and compare the median and mode of the average precipitation.
Shapes of Data Song
Introduces different shapes that data distributions can have and explains how data points that are far from group can pull the “center” of the data to the the left or the right.
Spread and Center
The Mean, Median and Mode Toads
How to find the mean median and mode?
In this video, Cody gets a little help from the mean median and mode toads.
Mean Median and Mode
Find the mean, median and mode of a set of numbers.
Mean Median & Mode Song
Mean, Median, and Mode
This video explains how to determine mean, median and mode. It also provided examples.
Try out our new and fun Fraction Concoction Game.
Add and subtract fractions to make exciting fraction concoctions following a recipe. There are four levels of difficulty: Easy, medium, hard and insane. Practice the basics of fraction addition and subtraction or challenge yourself with the insane level.

We welcome your feedback, comments and questions about this site or page. Please submit your feedback or enquiries via our Feedback page.