Data Representation Worksheets
Related Pages
Math Worksheets
Lessons for First Grade
Free Printable Worksheets
Printable “Data Representation” worksheets:
Data Representation (First Grade)
Tally Charts
Picture Graphs
Bar Graphs
Scaled Bar Graphs
Line Plots
Data Representation Worksheets
For first-grade students, introducing data representation involves using simple, visual methods to organize and interpret information.
- Introduction to Data:
Start by explaining that data is information or facts that can be collected and organized. - Visual Representations:
Use visual representations such as pictures, graphs, or charts. For first graders, focus on simple and intuitive representations like pictographs, tally charts, and bar graphs. - Concrete Examples:
Start with concrete examples. For instance, if you’re collecting data on favorite fruits, have actual fruits present in the classroom. - Collecting Data:
Engage students in the process of collecting data. For example, ask each student to name their favorite color and record the responses on the board. - Pictographs:
Introduce pictographs, where pictures represent the data. For example, each smiley face or picture could represent one student’s response. - Simple Bar Graphs:
Introduce simple bar graphs where bars represent the data. For instance, each bar could represent the number of students who like a specific color. - Making Observations:
Help students make simple observations about the data. Ask questions like “Which category has the most?” or “How many students like apples?” - Hands-On Activities:
Engage in hands-on activities where students physically arrange objects or drawings to represent the data they collected. - Language:
Use simple language to explain concepts. For example, “more” and “less” can be used to compare quantities.
Example:
Data Question: What is the favorite fruit of students in the class?
Data Collection: Students say their favorite fruits, and the teacher records responses on the board.
Data Representation: Create a simple pictograph with pictures of fruits representing each student’s favorite fruit.
Ask questions that require interpretation, such as “How many more students like apples than bananas?"
Conclusion:
The goal is to make data representation a hands-on and engaging experience for first graders. Simple, visual representations and relatable examples will help build a foundation for understanding more complex data concepts in the future.
Have a look at this video if you need to review how to answer data representation problems for first grade.
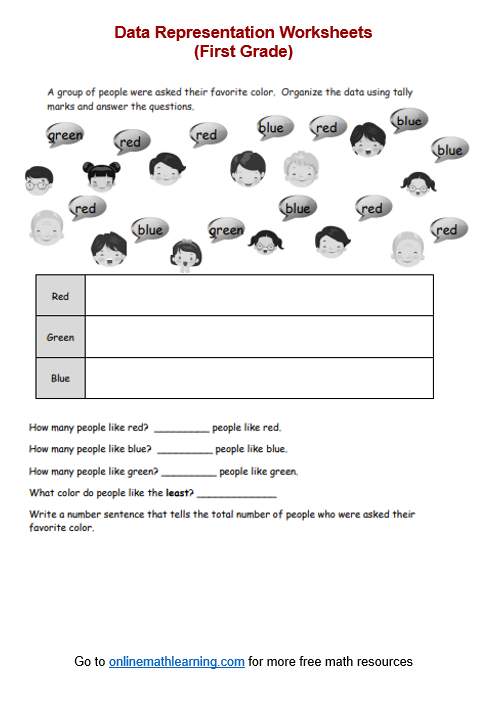
Click on the following worksheet to get a printable pdf document.
Scroll down the page for more Data Representation Worksheets.
More Data Representation Worksheets
(Answers on the second page)
Data Representation Worksheet #1 (Pictograph)
Data Representation Worksheet #2 (Tally Chart)
Data Representation Worksheet #3 (Pictograph)
Data Representation Worksheet #4 (Column Chart)
Data Representation Worksheet #5 (Column Chart)
Data Representation Worksheet #6 (Number Sentence)
Data Representation Worksheet #7 (Number Sentence)
Data Representation Worksheet #8 (Number Sentence)
Related Worksheets
Try the free Mathway calculator and
problem solver below to practice various math topics. Try the given examples, or type in your own
problem and check your answer with the step-by-step explanations.

We welcome your feedback, comments and questions about this site or page. Please submit your feedback or enquiries via our Feedback page.
