Illustrative Mathematics Grade 8, Unit 8, Lesson 11: Finding Distances in the Coordinate Plane
Learning Targets:
- I can find the distance between two points in the coordinate plane.
- I can find the length of a diagonal line segment in the coordinate plane.
Related Pages
Illustrative Math
Grade 8
Lesson 11: Finding Distances in the Coordinate Plane
Let’s find distances in the coordinate plane.
Illustrative Math Unit 8.8, Lesson 11 (printable worksheets)
Lesson 11 Summary
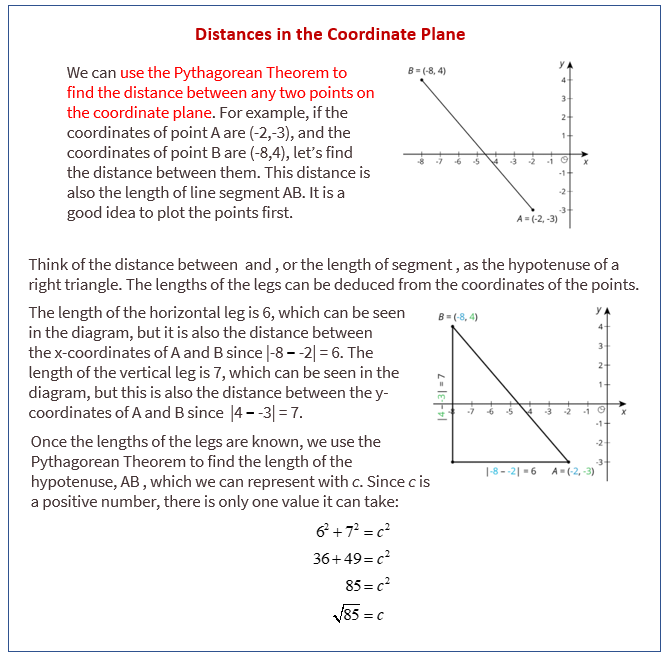
The following diagram shows how to find the distance between two points in the coordinate plane.

Lesson 11.1 Closest Distance
- Order the following pairs of coordinates from closest to farthest apart. Be prepared to explain your reasoning.
- Name another pair of coordinates that would be closer together than the first pair on your list.
- Name another pair of coordinates that would be farther apart than the last pair on your list.
Lesson 11.2 How Far Apart?
Find the distances between the three points shown.
Lesson 11.3 Perimeters with Pythagoras
- Which figure do you think has the longer perimeter?
- Select one figure and calculate its perimeter. Your partner will calculate the perimeter of the other. Were you correct about which figure had the longer perimeter?
Are you ready for more?
Quadrilateral ABCD has vertices at A = (-5,1), B = (-4,4), C = (2,2), and (1,-1).
- Use the Pythagorean Theorem to find the lengths of sides AB, BC, CD, and AD.
- Use the Pythagorean Theorem to find the lengths of the two diagonals, AC and BD.
- Explain why quadrilateral ABCD is a rectangle.
Lesson 11.4 Finding the Right Distance
Have each person in your group select one of the sets of coordinate pairs shown here. Then calculate the length of the line segment between those two coordinates. Once the values are calculated, have each person in the group briefly share how they did their calculations.
- How does the value you found compare to the rest of your group?
- In your own words, write an explanation to another student for how to find the distance between any two coordinate pairs.
Lesson 11 Practice Problems
- The right triangles are drawn in the coordinate plane, and the coordinates of their vertices are labeled. For each right triangle, label each leg with its length.
- Find the distance between each pair of points. If you get stuck, try plotting the points on graph paper.
- Which line has a slope of 0.625, and which line has a slope of 1.6? Explain why the slopes of these lines are 0.625 and 1.6.
- Write an equation for the graph.
The Open Up Resources math curriculum is free to download from the Open Up Resources website and is also available from Illustrative Mathematics.
Try out our new and fun Fraction Concoction Game.
Add and subtract fractions to make exciting fraction concoctions following a recipe. There are four levels of difficulty: Easy, medium, hard and insane. Practice the basics of fraction addition and subtraction or challenge yourself with the insane level.

We welcome your feedback, comments and questions about this site or page. Please submit your feedback or enquiries via our Feedback page.