Distance-Time Graphs and Speed-Time Graphs
Related Pages
Distance-Time and Speed-Time Graphs
More Lessons for GCSE Maths
Math Worksheets
These lessons, with videos, examples and step-by-step solutions, help GCSE Maths students learn how to read distance-time graphs and speed-time graphs.
Distance-Time Graph
A distance-time graph is a graphical representation that shows how the distance of an object from a starting point changes over a period of time.
Key Features of a Distance-Time Graph
X-axis (Horizontal): Time (t) in seconds, minutes, or hours.
Y-axis (Vertical): Distance (d) from a reference point (e.g., meters, kilometers).
Line/Curve: Shows how distance changes with time.
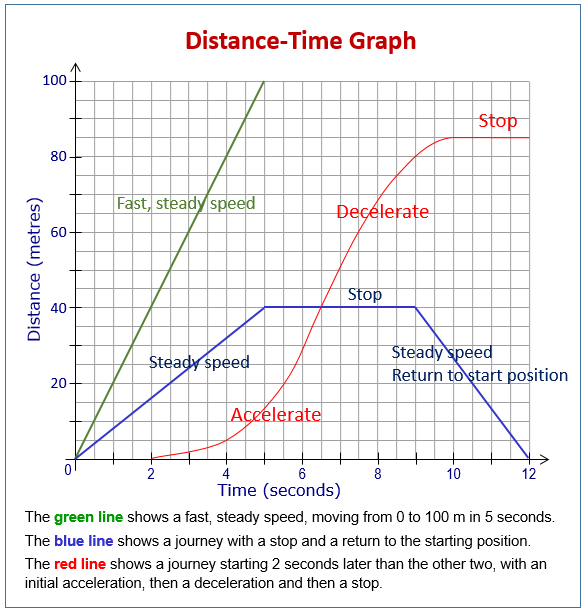
The following diagram shows examples of distance-time graphs. Scroll down the page for more examples and solutions on how to use the distance-time-graph.

The slope (or gradient) of the line on a distance-time graph represents the speed of the object.
Formula:
\(\text{slope} =\text{speed} = \frac{\text{change in distance}}{\text{change in time}} =\frac{\Delta d}{\Delta t} \)
Interpreting the Distance-Time Graph
-
Horizontal Line (Zero Slope):
The object is stationary (at rest). Its speed is 0. -
Straight Sloping Line (Constant Positive Slope):
The object is moving at a constant speed (uniform motion).
Steeper Slope: Indicates a faster constant speed.
Gentler Slope: Indicates a slower constant speed. -
Curved Line (Changing Slope):
The speed of the object is changing over time.
The object is speeding up or slowing down.
Curve getting steeper: The speed is increasing (acceleration).
Curve getting flatter: The speed is decreasing (deceleration). -
Line Sloping Downwards (Negative Slope):
The distance from the starting point is decreasing over time.
The object is moving back towards the starting point.
The absolute value of the slope still represents the speed.
Distance Time Graphs - part 1a
Review of the meaning of slope using distance-time graphs.
Distance Time Graphs - part 1b
Velocity-Time Graph
A velocity-time graph is a visual representation of how an object’s velocity changes over a period of time.
The x-axis represents time, the y-axis represents velocity and the line represents how velocity changes with time.
The slope (or gradient) of the line on a velocity-time graph represents the acceleration of the object.
Formula:
\(\text{acceleration} = \frac{\text{change in velocity}}{\text{change in time}} =\frac{\Delta v}{\Delta t} \)
Interpreting the Distance-Time Graph
Horizontal Line (Slope = 0): The velocity is constant. This means the object is moving at a constant velocity (zero acceleration).
Straight Sloping Line (Constant Slope): The velocity is changing at a steady rate. This indicates constant acceleration.
Positive Slope (Line goes upwards): The velocity is increasing.
Negative Slope (Line goes downwards): The velocity is decreasing.
Steeper Slope: Indicates a greater magnitude of acceleration.
Curved Line (Changing Slope): The acceleration is changing.
The Area Under the Curve = Displacement
Velocity vs. Time Graph, Part 1
Describes how to read a velocity vs. time graph including direction of motion, velocity, acceleration and how to calculate the acceleration.
Velocity vs. Time Graph, Part 2
Describes how to determine the acceleration of an object three different ways from the graph of its velocity over time.
Try out our new and fun Fraction Concoction Game.
Add and subtract fractions to make exciting fraction concoctions following a recipe. There are four levels of difficulty: Easy, medium, hard and insane. Practice the basics of fraction addition and subtraction or challenge yourself with the insane level.

We welcome your feedback, comments and questions about this site or page. Please submit your feedback or enquiries via our Feedback page.