Illustrative Mathematics Grade 8, Unit 5, Lesson 11: Filling containers
Learning Targets:
- I can collect data about a function and represent it as a graph.
- I can describe the graph of a function in words.
Related Pages
Illustrative Math
Grade 8
Lesson 11: Filling containers
Let’s fill containers with water.
Illustrative Math Unit 8.5, Lesson 11 (printable worksheets)
Lesson 11 Summary
The following diagram shows how to describe the graph of a function in words.

Lesson 11.1 Which One Doesn’t Belong: Solids
These are drawings of three-dimensional objects. Which one doesn’t belong? Explain your reasoning.
Lesson 11.2 Height and Volume
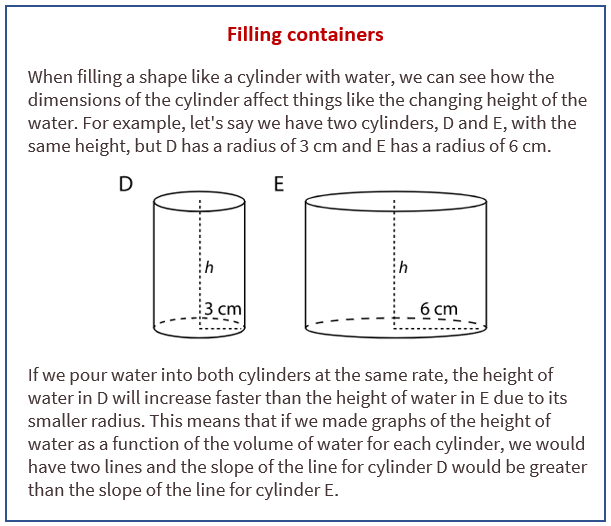
Use the applet to investigate the height of water in the cylinder as a function of the water volume.
- Before you get started, make a prediction about the shape of the graph.
- Check Reset and set the radius and height of the graduated cylinder to values you choose.
- Let the cylinder fill with different amounts of water and record the data in the table.
Open Applet - Create a graph that shows the height of the water in the cylinder as a function of the water volume.
- Choose a point on the graph and explain its meaning in the context of the situation.
Open Applet
Lesson 11.3 What Is the Shape?
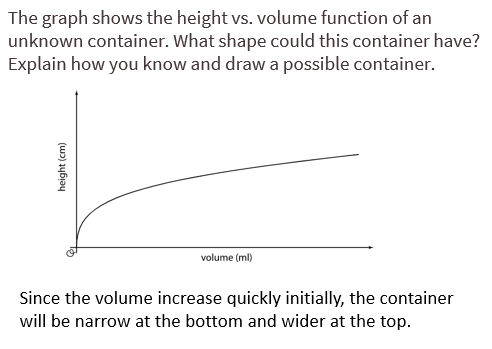
- The graph shows the height vs. volume function of an unknown container. What shape could this container have? Explain how you know and draw a possible container.
- The graph shows the height vs. volume function of a different unknown container. What shape could this container have? Explain how you know and draw a possible container.
- How are the two containers similar? How are they different?
Are you ready for more?
The graph shows the height vs. volume function of an unknown container. What shape could this container have? Explain how you know and draw a possible container.
Lesson 11 Practice Problems
- Cylinder A, B, and C have the same radius but different heights. Put the cylinders in order of their volume from least to greatest.
- Two cylinders, a and b, each started with different amounts of water. The graph shows how the height of the water changed as the volume of water increased in each cylinder. Match the graphs of a and b to Cylinders P and Q. Explain your reasoning.
- Which of the following graphs could represent the volume of water in a cylinder as a function of its height? Explain your reasoning.
- Together, the areas of the rectangles sum to 30 square centimeters.
a. Write an equation showing the relationship between x and y.
b. Fill in the table with the missing values.
The Open Up Resources math curriculum is free to download from the Open Up Resources website and is also available from Illustrative Mathematics.
Try the free Mathway calculator and
problem solver below to practice various math topics. Try the given examples, or type in your own
problem and check your answer with the step-by-step explanations.

We welcome your feedback, comments and questions about this site or page. Please submit your feedback or enquiries via our Feedback page.
