The Slope of a Non-Vertical Line
Related Topics:
Lesson Plans and Worksheets for Grade 8
Lesson Plans and Worksheets for all Grades
More Lessons for Grade 8
Common Core For Grade 8
Examples, videos, and solutions to help Grade 8 students learn what is meant by the slope of a line.
New York State Common Core Math Grade 8, Module 4, Lesson 15
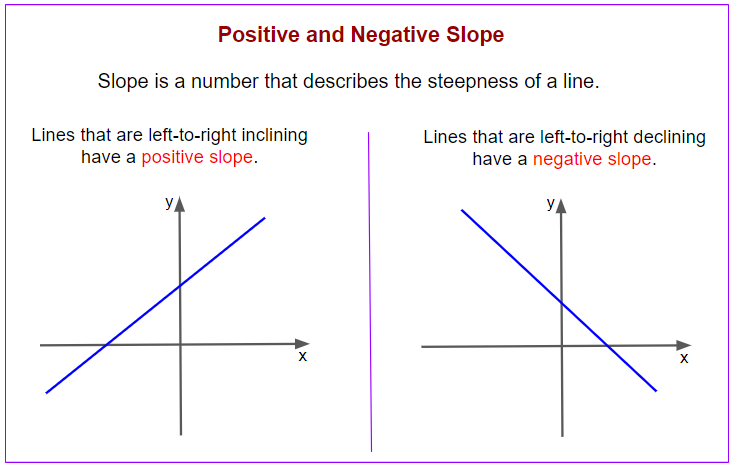
The following diagram shows the difference between positive and negative slope. Scroll down the page for more examples and solutions.

Lesson 15 Student Outcomes
- Students know slope is a number that describes the steepness or slant of a line.
- Students interpret the unit rate as the slope of a graph.
Lesson 15 Summary
Slope is a number that describes the steepness of a line. Slope is represented by the symbol m.
Lines that are left-to-right inclining have a positive slope.
Lines that are left-to-right declining have a negative slope.
Determine the slope of a line when the horizontal distance between points is fixed at by translating point Q to the origin of the graph, and then identifying the y-coordinate of point R.
Lesson 15 Opening Exercise
Repeat for different pairs of lines.
a. Which graph is steeper?
b. Write directions that explain how to move from one point on the graph to the other for each of Graph A and Graph B.
c. Write the directions from part (b) as ratios, and then compare the ratios. How does this relate to which graph was steeper in part (a)?
Example 1:
Lines that are left-to-right inclining are said to have a positive slope and lines that are left-to-right declining are said to have negative slope.
Example 2:
Explains why the slope of lines that are left-to-right inclining are positive.
Example 3:
Explains why the slope of lines that are left-to-right declining are negative.
Example 4:
In general, we describe slope as an integer or a fraction.
Exercises 1–6
Use your transparency to find the slope of each line if needed.
1 - 2. What is the slope of this non-vertical line?
3. Which of the lines in Exercises 1 and 2 is steeper? Compare the slopes of each of the lines. Is there a relationship between steepness and slope?
4 - 6. What is the slope of this non-vertical line?
Example 5:
When we graph proportional relationships, the unit rate is interpreted as the slope of the graph of the line, which is why slope is referred to as the rate of change.
Try the free Mathway calculator and
problem solver below to practice various math topics. Try the given examples, or type in your own
problem and check your answer with the step-by-step explanations.

We welcome your feedback, comments and questions about this site or page. Please submit your feedback or enquiries via our Feedback page.