Equation Of A Line Parallel To The X-Axis Or Y-Axis
In this lesson, we will learn
- what is the equation of a horizontal line or a line parallel to the x-axis.
- how to graph the horizontal line using a T-table.
- what is the equation of a vertical line or a line parallel to the y-axis.
- how to graph the vertical line using a T-table.
Equation of Line Parallel to the x-axis
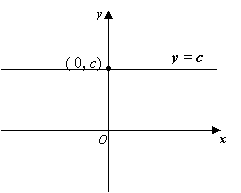
A line that is parallel to the x-axis and has a y-intercept of c. has the equation y = c. The line is a horizontal line with a slope of 0.

How to graph a horizontal line by using a table of values (T-table)?
Example:
Graph a line using a table of values.
y = -4
Equation of Line Parallel to the y-axis
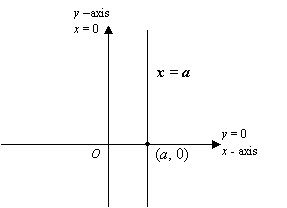
A line that is parallel to the y-axis and has a x-intercept of a has the equation of x = a. The line is a vertical line that has no slope and no y-intercept. The slope is also said to be undefined.

How to graph a vertical line by using a table of values?
Example:
Graph a line using a table of values
x = 3
How to graph horizontal and vertical lines?
Example 1:
a) Graph y = -2.
b) The graph consists of all ordered pairs whose y-coordinate is -2.
Example 2:
a) Graph x = 3.
b) The graph consists of all ordered pairs whose x-coordinate is 3.
The graph of y = c or f(x) = c, a horizontal line, is the graph of a function. Such a function is referred to as a t function.
The graph of x = a, a vertical line is not the graph of a function.
Try the free Mathway calculator and
problem solver below to practice various math topics. Try the given examples, or type in your own
problem and check your answer with the step-by-step explanations.

We welcome your feedback, comments and questions about this site or page. Please submit your feedback or enquiries via our Feedback page.