Graph Linear Equations
In this lesson, we will learn
- how to graph a linear equation when the equation is given in slope-intercept form.
- how to graph a linear equation when the equation is given in general form.
Other methods used to graph linear equations are by plotting points and using x-intercept and y-intercept.
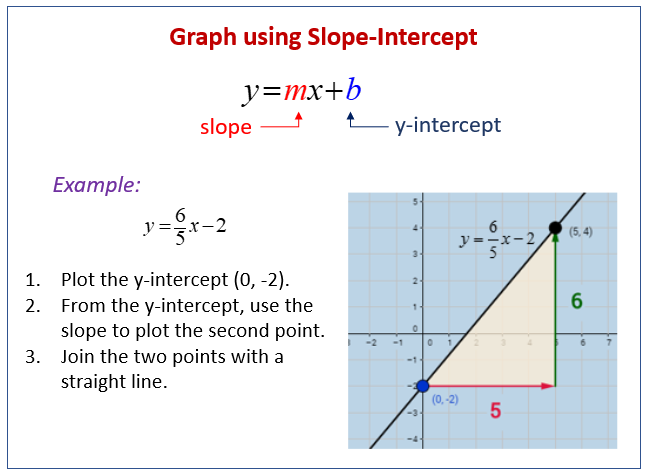
The following diagram shows how to graph a linear equation using slope-intercept. Scroll down the page for more examples and solutions.

Graph Linear Equations in Slope-Intercept Form
When we are given a slope-intercept form of a linear equation, we can use the slope and y-intercept to graph the equation.
The slope-intercept form of an equation is
y = mx + b, where m is the slope of the line and b is the y-intercept.
Step 1: Find the y-intercept and plot the point.
Step 2: From the y-intercept, use the slope to find the second point and plot it.
Step 3: Draw a line to connect the two points.
How to graph a line given in slope-intercept form?
Slope intercept formula
We look at what slope and intercept mean as well as how to graph the equation.
Graph Linear Equations in General Form
The equation y = mx*+ b* gives us information on the slope and the y-intercept. If the equation of a line is given in a different form, we rewrite it in the form y = mx*+ b* in order to get the slope and y-intercept of the line. * Example**** :***
Rewrite the following equation in slope-intercept form to determine the slope and y-intercept:
3x = 4y – 7
Solution:
Rewrite 3x = 4y – 7 in the form y = mx*+ c*
3x = 4y – 7
4y = 3x + 7
y = ![]()
The slope is ![]() and the y-intercept is
and the y-intercept is ![]()
How to convert a linear equation from standard form to slope-intercept form and graphing?
How to linear equations given in general form?
Slope and intercept of a linear equation
Try the free Mathway calculator and
problem solver below to practice various math topics. Try the given examples, or type in your own
problem and check your answer with the step-by-step explanations.

We welcome your feedback, comments and questions about this site or page. Please submit your feedback or enquiries via our Feedback page.