Graph Linear Inequalities in Two Variables Worksheets
Related Topics:
Math Worksheets according to Topics
Algebra I Math Lessons
Printable “Linear Inequality” worksheets:
Solve 1-step inequalities (addition & subtraction)
Solve 1-step inequalities (multiplication & division)
Solve 1-step inequalities (all operations)
Solve linear inequalities (include number lines)
Graph compound inequalities on the number line
Solve & graph compound inequalities
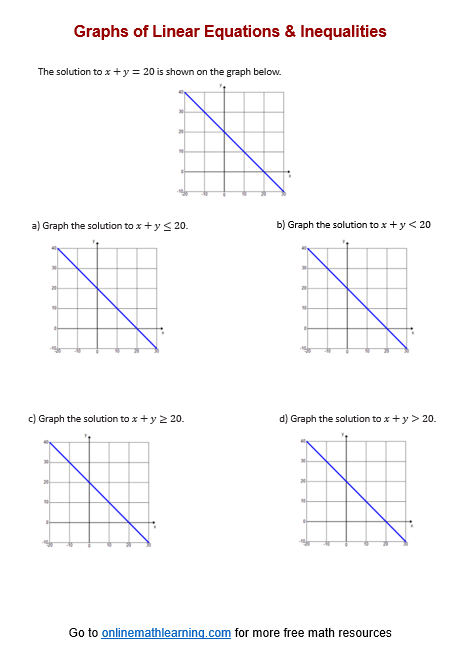
Solve & graph inequalities with two variables
Examples, solutions, videos, and worksheets to help Grade 8 students learn how to find and graph solution sets to inequalities with two variables on the coordinate plane.
How to graph linear equations & inequalities?
Graphing Linear Equations
A linear equation in two variables, typically written in the form y = mx + b, represents a straight line on a coordinate plane. The m is the slope of the line, and b is the y-intercept.
Steps to graph a linear equation:
- Find the y-intercept: The y-intercept is the point where the line crosses the y-axis. It’s the value of b in the equation. Plot this point on the y-axis.
- Use the slope to find another point: The slope, m, tells you how much the line rises or falls for every unit of horizontal change.
- If m is positive, the line rises from left to right.
- If m is negative, the line falls from left to right.
- For example, if m = 2, you can move 2 units up and 1 unit to the right from the y-intercept.
- Draw a line through the points: Use a ruler to draw a straight line through the two points you plotted.
Graphing Linear Inequalities
Steps to graph a linear inequality:
- Graph the boundary line: Treat the inequality as an equation and graph the corresponding line.
- Use a solid line for inequalities with ≤ or ≥ symbols.
- Use a dashed line for inequalities with < or > symbols.
- Test a point: Choose a point not on the line, usually (0,0) is easiest.
- Shade the appropriate region:
- If the test point satisfies the inequality, shade the region containing the point.
- If the test point does not satisfy the inequality, shade the region not containing the point.
Have a look at this video if you need to review how to graph linear inequalities in two variables.
Click on the following worksheet to get a printable pdf document.
Scroll down the page for more Graph Linear Inequalities Worksheets.
More Graph Linear Inequalities Worksheets
Printable
(Answers on the second page.)
Graph Linear Inequalities Worksheets #1
Graph Linear Inequalities Worksheets #2
Graph Linear Inequalities Worksheets #3
Graph Linear Inequalities Worksheets #4
Graph Linear Inequalities Worksheets #5
Graph Linear Inequalities Worksheets #6
Graph Linear Inequalities Worksheets #7
Graph Linear Inequalities Worksheets #8 (match linear equations)
Graph Linear Inequalities Worksheets #9 (match linear inequalities)
Related Lessons & Worksheets
Try out our new and fun Fraction Concoction Game.
Add and subtract fractions to make exciting fraction concoctions following a recipe. There are four levels of difficulty: Easy, medium, hard and insane. Practice the basics of fraction addition and subtraction or challenge yourself with the insane level.

We welcome your feedback, comments and questions about this site or page. Please submit your feedback or enquiries via our Feedback page.
