Graphing Radical Equations
Related Topics:
Grade 11 & Grade 12 Algebra 1 lessons
Examples, solutions, videos, worksheets, games, and activities to help Algebra 1 students learn how to graph radical equations.
Radical functions are functions that involve roots, such as square roots, cube roots, etc. The most common radical function is the square root function, f(x) = √x. Graphing radical functions involves understanding their domain, range, shape, and transformations.
In these lessons, we will learn how to graph radical equations or radical functions by plotting points or by using shifts and transformations.
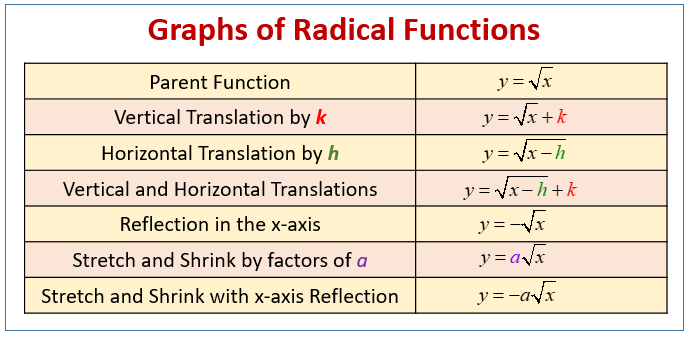
The following diagram shows a summary of Radical Function Transformations. Scroll down the page for more examples and solutions of graphs of radical functions.

Basic Shape of a square root function
The graph of the most basic square root function, y = √x, starts at the origin (0, 0) and extends to the right, curving upwards. It resembles half of a parabola turned on its side. This is because you cannot take the square root of a negative number, so the graph only exists for non-negative x-values.
Transformations
Several factors can modify the graph of a radical function:
- Vertical Stretching/Shrinking
Multiplying the radical by a constant greater than 1 stretches the graph vertically.
Multiplying by a constant between 0 and 1 shrinks the graph vertically. - Reflection
Multiplying the radical by a negative number reflects the graph across the x-axis. - Vertical Shift
Adding a constant outside the radical shifts the entire graph up or down.
y = √x + k shifts the graph up by k units.
y = √x - k shifts the graph down by k units. - Horizontal Shift
Adding or subtracting a constant inside the radical shifts the graph left or right.
y = √(x - h) shifts the graph to the right by h units.
y = √(x + h) shifts the graph to the left by h units.
Domain and Range
Domain: The domain of a radical function is restricted by the radicand (the expression inside the radical). The radicand must be greater than or equal to zero.
Range: The range of a basic square root function starts at zero and extends upwards. Transformations like vertical shifts and reflections can affect the range.
Graphing Radical Functions
Find the Domain: Determine the values of x for which the radicand is non-negative.
Plot Key Points: Choose some x-values within the domain, especially those that result in perfect squares inside the radical (to make calculations easier). Calculate the corresponding y-values and plot these points.
Sketch the Curve: Connect the points with a smooth curve, keeping in mind the general shape of a radical function.
Graphing Radical Equations using a Table or Plotting Points
One way to graph radical functions is to create a table of values and then plot the points. Before starting the table, first determine the domain of the function. Remember, the radical must be greater than or equal to zero. Once this lower limit for input (domain) values is established, create the table of values. When graphing radicals we plot the points in the coordinate plane.
This video is a demonstration of graphing radical equations by first (1) finding the domain, and (2) using an x-y table.
Graphing radical equations.
Graphing Radical Equations using Shifts or Transformations
When graphing radical equations using shifts:
Adding or subtracting a constant that is not in the radical will shift the graph up (adding) or down (subtracting).
Adding or subtracting a constant that is in the radical will shift the graph left (adding) or right (subtracting).
Multiplying a negative constant by the equation will reflect the graph over the x-axis. Multiplying by a number larger than one increases the y-values.
Graphs of Radical Functions: This video will teach you how to graph radical functions and their translations.
Graphing Radicals using Vertical/Horizontal shifts and scaling.
Graphing Radical Functions.
Graphing Radical Functions - square root function and cube root function.
Graphing Radical Functions
y = sqrt(x) + 3
y = sqrt(x) - 3
y = cuberoot(x) + 2
y = cuberoot(x) - 2
y = sqrt(x + 4)
y = sqrt(x - 4)
y = cuberoot(x + 5)
y = cuberoot(x - 5)
y = sqrt(x - 3) + 5
Graphing Square Root and Other Radical Functions.
Try the free Mathway calculator and
problem solver below to practice various math topics. Try the given examples, or type in your own
problem and check your answer with the step-by-step explanations.

We welcome your feedback, comments and questions about this site or page. Please submit your feedback or enquiries via our Feedback page.