Graphing Exponential Functions
Examples, solutions, videos, worksheets, games and activities to help PreCalculus students learn how to graph exponential functions.
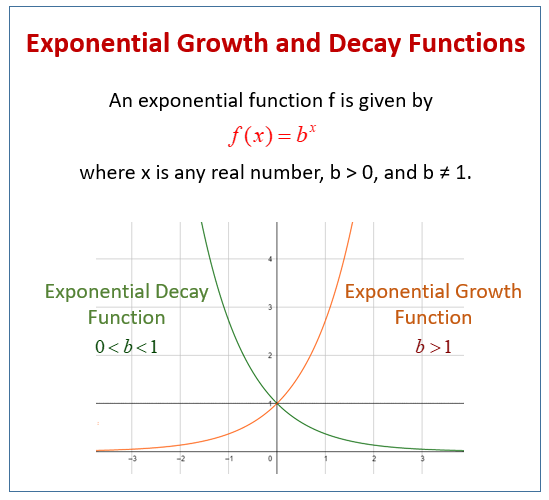
The following diagrams show the exponential growth and exponential decay graphs. Scroll down the page for more examples and solutions on how to graph exponential functions.

Graph Exponential Functions
An exponential function f is given by
f(x) = bx
where x is any real number, b > 0, and b ≠ 1. The number b is called the base.
If b > 1, f(x) is a positive, increasing continuous function. In this case, f(x) is called an exponential growth function.
If 0 < b < 1, f(x) is a positive, decreasing, continuous function. In this case, f(x) is called an exponential decay function.
Exponential Functions and their Graphs
There are certain functions, such as exponential functions, that have many applications to the real world and have useful inverse functions. Graphing exponential functions is used frequently, we often hear of situations that have exponential growth or exponential decay. The inverses of exponential functions are logarithmic functions. The graphs of exponential functions are used to analyze and interpret data.
A discussion of exponential functions and their graphs.
Learn how to graph exponential functions
Graphing Exponential Functions
This video shows how to graph two exponential functions by plotting points, discusses the domain and range and asymptotes as well as 4 extra graphs using transformations.
Try out our new and fun Fraction Concoction Game.
Add and subtract fractions to make exciting fraction concoctions following a recipe. There are four levels of difficulty: Easy, medium, hard and insane. Practice the basics of fraction addition and subtraction or challenge yourself with the insane level.

We welcome your feedback, comments and questions about this site or page. Please submit your feedback or enquiries via our Feedback page.