
Graphing Sine and Cosine Functions
Related Topics:
More Lessons for Trigonometry
Math Worksheets
A series of free Trigonometry Lessons.
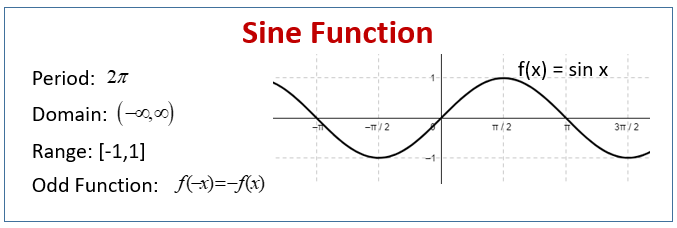
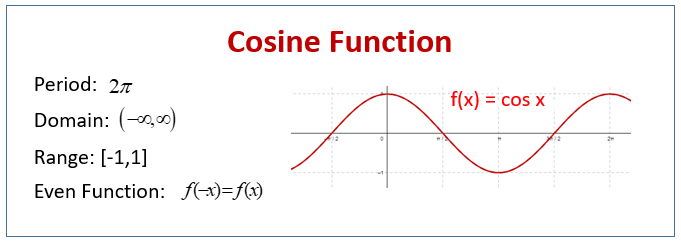
The following diagrams show the characteristics of sine graphs. Scroll down the page for more examples and solutions on graphing sine functions.
Example:
State the amplitude and period of each of the following functions:
a) y = -4cos(3x)
b) y = 1/2 sin(x)
Finding Maximum and Minimum Values and Zeros of Sine and Cosine
Example:
Find the maximum value and minimum value for the functions:
a) y = 6 sin(7x)
b) y = -1/2 cos(3πx)
Solving Word Problems Involving Sine or Cosine Functions
Example:
A market research company finds that traffic in a local mall over the course of a day could be estimated by
P(t) = -2000 cos(π/6 t) + 2000


More Lessons for Trigonometry
Math Worksheets
A series of free Trigonometry Lessons.
The following diagrams show the characteristics of sine graphs. Scroll down the page for more examples and solutions on graphing sine functions.


Example:
State the amplitude and period of each of the following functions:
a) y = -4cos(3x)
b) y = 1/2 sin(x)
Example:
Find the maximum value and minimum value for the functions:
a) y = 6 sin(7x)
b) y = -1/2 cos(3πx)
Example:
A market research company finds that traffic in a local mall over the course of a day could be estimated by
P(t) = -2000 cos(π/6 t) + 2000
Try out our new and fun Fraction Concoction Game.
Add and subtract fractions to make exciting fraction concoctions following a recipe. There are four levels of difficulty: Easy, medium, hard and insane. Practice the basics of fraction addition and subtraction or challenge yourself with the insane level.


We welcome your feedback, comments and questions about this site or page. Please submit your feedback or enquiries via our Feedback page.