Solving Systems of Equations Graphically
Related Topics:
More Lessons for Basic Algebra
Math Worksheets
Examples, videos, worksheets, solution, and activities to help Algebra 1 students learn how to solve systems of linear equations graphically.
A system of equations (also known as a simultaneous equation system) is a set of two or more equations that share the same variables. The goal when solving a system of equations is to find the values for those variables that make all of the equations in the system true at the same time.
How to solve a system of equations using the graphical method?
- Write the equations in slope-intercept form (y = mx + b).
- Graph both equations on the same coordinate plane.
- Identify the intersection point.
- Check the solution
Types of Solutions:
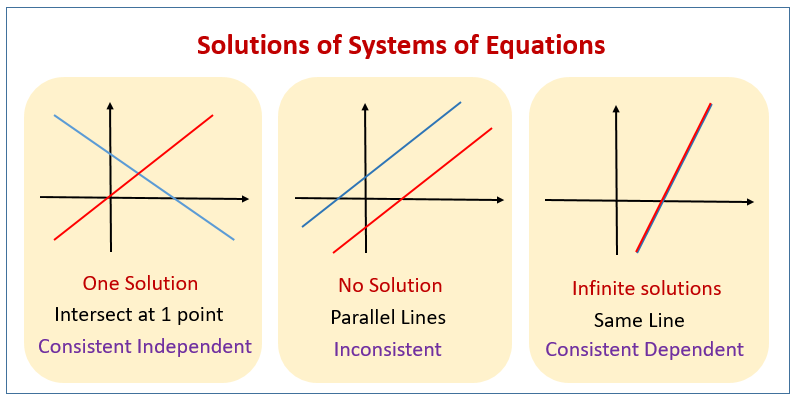
- One intersection point: The system has one unique solution. Also called a consistent, independent system.
- Parallel lines: The lines never intersect, meaning the system has no solution. Also called an inconsistent system.
- Same line: The lines overlap completely, meaning the system has infinitely many solutions. Also called a consistent, dependent system
The following diagrams show the three types of solutions that can be obtained from a system of linear equations. Scroll down the page for more examples and solutions on graphing systems of linear equations.

How to solve a system of linear equations by graphing?
The first step is to graph each of the given equations, then find the point of intersection of the two lines, which is the solution to the system of equations.
If the two lines are parallel, then the solution to the system is the null set.
If the two given equations represent the same line, then the solution to the system is the equation of that line.
Solving Systems of Equations Graphically
Some examples on solving systems of equations graphically.
Examples:
Solve x + y = 1, x - y = -5
Solve y = 2x -4, y = -1/2 x + 1
Solve 2x + 3y = 6, y = -2/3 x - 2
Graphing Systems of Equations
Example:
y = 3/2 x + 1
y = -x + 6
Solve a system of equations by graphing
Example:
Solve the following system of equations by graphing
y = 2x + 1, x + y = 4
Graphing Systems of Equations
Example:
Solve the system of equations by graphing
5x + 3y = 7, 3x - 2y = 8
Methods for Solving Systems of Equations:
There are several methods for finding the solution to a system of equations, including:
- Graphical Method: Plotting the equations on a graph and finding the intersection points.
- Substitution Method: Solving one equation for one variable and substituting that expression into the other equation.
- Elimination Method (or Addition Method): Adding or subtracting multiples of the equations to eliminate one of the variables.
- Matrix Methods (for larger systems): Using techniques from linear algebra.
Try out our new and fun Fraction Concoction Game.
Add and subtract fractions to make exciting fraction concoctions following a recipe. There are four levels of difficulty: Easy, medium, hard and insane. Practice the basics of fraction addition and subtraction or challenge yourself with the insane level.

We welcome your feedback, comments and questions about this site or page. Please submit your feedback or enquiries via our Feedback page.