Grouped Frequency Tables
Related Topics:
More Lessons for GCSE Math
Math Worksheets
Examples, videos and solutions to help GCSE Maths students learn how to find the mean and median from a grouped frequency table.
When you have data presented in a grouped frequency table, you don’t have the individual data points. Instead, you have ranges (class intervals) and the frequency of observations within each range. Because of this, you cannot calculate the exact mean; you can only calculate an estimate of the mean.
The fundamental idea is to assume that the values within each class interval are evenly distributed, and thus, the midpoint of each class can represent all the data points in that class.
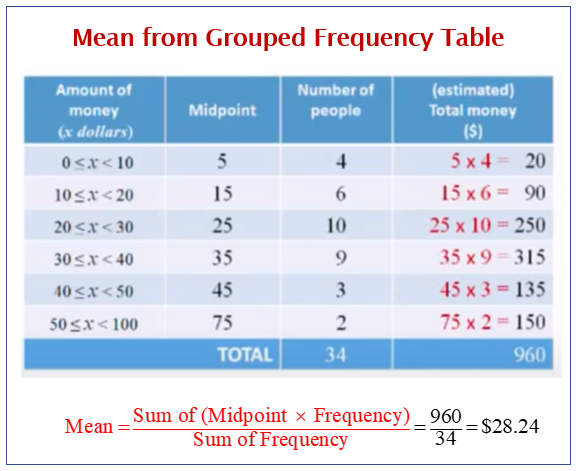
The following diagram shows how to find the mean for grouped data in a frequency table. Scroll down the page for more examples and solutions.

Statistics Worksheets
Practice your skills with the following worksheets:
Printable & Online Statistics Worksheets
How to calculate the mean for grouped data in a frequency table?
- For each class interval, calculate its midpoint (m). The midpoint is the average of the lower class limit and the upper class limit.
\(m=\frac{\text{Lower Class Limit + Upper Class Limit}}{2}\) - Create a new column in your table. For each row (class interval), multiply the midpoint you calculated in step 1 by its corresponding frequency.
- Add up all the values in the new column.
- Add up all the frequencies in the frequency column. This gives you the total number of observations.
- Divide the sum from step 3 by the sum from step 4 to get the estimated mean.
Steps to Find the Median for grouped data in a frequency table:
- Add up all the frequencies in the frequency column. This gives you the total number of observations (N).
- Calculate Cumulative Frequencies: Add a new column to your frequency table for cumulative frequency.
- Determine the Median Position:
Calculate \(\frac{N}{2}\). This value tells you where the “middle” observation lies in the ordered dataset. Some texts may use \(\frac{N+1}{2}\). - Identify the Median Class:
Look at your cumulative frequency column. The median class is the first class interval whose cumulative frequency is greater than or equal to the median position you calculated in step 3.
Videos
Finding the mean from grouped frequency tables
Finding the median from grouped frequency tables
Determining the Mean for Grouped Data
Example:
- A sample of car owners was asked how old they were when they got their first car. The results were then reported in a frequency distribution. Calculate the mean.
- A survey of athletes asked how many hours they train per week. The results were then reported in a frequency distribution. Calculate the mean.
GCSE Unit 1 Mean from a Grouped Data Table
Try out our new and fun Fraction Concoction Game.
Add and subtract fractions to make exciting fraction concoctions following a recipe. There are four levels of difficulty: Easy, medium, hard and insane. Practice the basics of fraction addition and subtraction or challenge yourself with the insane level.

We welcome your feedback, comments and questions about this site or page. Please submit your feedback or enquiries via our Feedback page.