Interpret Mean Absolute Deviation Worksheet
Related Topics:
More Grade 6 Math Lessons
Free Math Worksheets
Free Printable Worksheets
Printable “Statistics” Worksheets:
Mean
Median
Mode
Range
Mean, Median, Mode
Mean Absolute Deviation
Interpret Mean Absolute Deviation
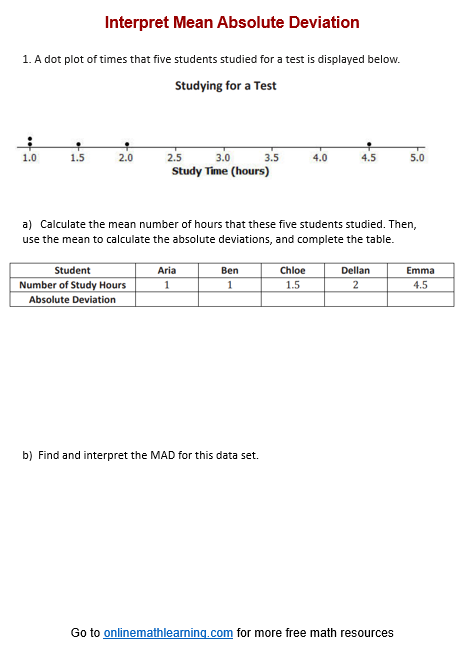
Free printable and online worksheets to help Grade 6 students review how to calculate the mean and MAD for a data distribution. How to use the mean and MAD to describe a data distribution in terms of center and variability.
Interpret Mean Absolute Deviation
Interpreting the mean and mean absolute deviation (MAD) in statistics provides insights into the central tendency and variability of a dataset. Here’s how you can interpret these measures:
The mean (or average) is the sum of all the data points divided by the number of data points. It represents the central value of the dataset.
The mean gives an indication of the central value around which the data points are distributed.
It can be thought of as the balance point of the data. If you imagine the data points as weights on a seesaw, the mean is the point where the seesaw balances.
The mean is sensitive to extreme values (outliers). A single outlier can significantly affect the mean, pulling it towards the outlier.
The mean absolute deviation is the average of the absolute differences between each data point and the mean of the dataset. It measures the average distance between each data point and the mean, providing a sense of the spread or variability of the data.
MAD indicates the average deviation of data points from the mean. A lower MAD suggests that data points are close to the mean, indicating low variability. A higher MAD suggests greater variability.
Robustness to Outliers: Unlike standard deviation, MAD is less sensitive to outliers because it uses absolute differences rather than squared differences.
Summary
Mean: Provides the central value of the dataset.
MAD: Measures the average distance of data points from the mean, indicating variability.
Complementary Measures: Together, the mean and MAD offer a comprehensive view of the dataset, with the mean indicating central tendency and MAD indicating spread.
Have a look at this video if you need to review how to calculate the Interpret Mean Absolute Deviation.
Click on the following worksheet to get a printable pdf document.
Scroll down the page for more Interpret Mean Absolute Deviation Worksheets.
More Interpret Mean Absolute Deviation Worksheets
Printable
(Answers on the second page.)
Interpret Mean Absolute Deviation Worksheet #1
Interpret Mean Absolute Deviation Worksheet #2
Interpret Mean Absolute Deviation Worksheet #3
Interpret Mean Absolute Deviation Worksheet #4
Interpret Mean Absolute Deviation Worksheet #5
Related Lessons & Worksheets
Interpret Mean Absolute Deviation
Try the free Mathway calculator and
problem solver below to practice various math topics. Try the given examples, or type in your own
problem and check your answer with the step-by-step explanations.

We welcome your feedback, comments and questions about this site or page. Please submit your feedback or enquiries via our Feedback page.
