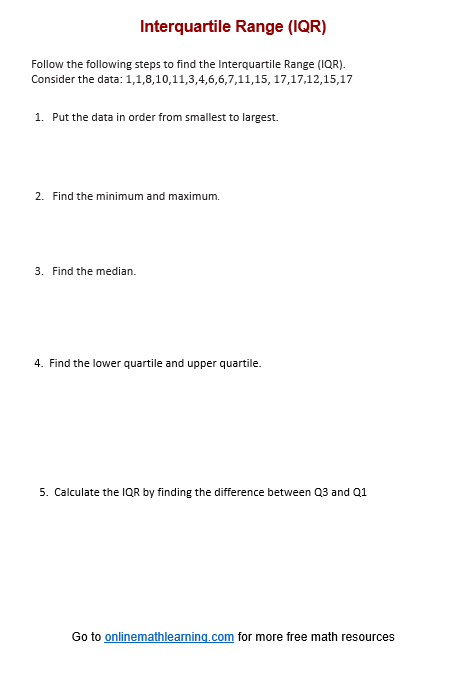
Interquartile Range Worksheet
Related Topics:
More Grade 6 Math Lessons
Free Math Worksheets
Free Printable Worksheets
Printable “Statistics” Worksheets:
Mean, Median, Mode, Range
Mean Absolute Deviation
Interpret Mean Absolute Deviation
Interpret Median
Interquartile Range (IQR)
Box Plot (Box-and-whisker Plot)
Free printable and online worksheets to help Grade 6 students review how to calculate the Interquartile Range (IQR) of a data set. Calculate the median of the data and describe the variability in the data by calculating the interquartile range. How to interpret the IQR of a data set.
Interquartile Range
The interquartile range (IQR) is a measure of statistical dispersion and variability. It describes the range within which the central 50% of the data points lie. Specifically, the IQR is the difference between the third quartile (Q3) and the first quartile (Q1) of a dataset. It provides a measure of the spread of the middle half of the data and is less sensitive to outliers than the range.
Calculation of the IQR:
- Sort the Data:
Arrange the data points in ascending order. - Determine the Quartiles:
First Quartile (Q1): The median of the lower half of the dataset (excluding the median if the number of data points is odd).
Third Quartile (Q3): The median of the upper half of the dataset (excluding the median if the number of data points is odd). - Calculate the IQR:
IQR = Q3 - Q1
Interpretation of the IQR
- Spread of Middle 50%:
The IQR measures the spread of the central 50% of the data. In the example above, the central 50% of the data points lie within a range of 5 units (from 2.5 to 7.5). - Robustness to Outliers:
The IQR is not affected by extreme values or outliers, making it a robust measure of variability. Unlike the range, which considers the extreme values, the IQR focuses on the middle portion of the data.
IQR is a valuable tool for understanding the spread of data within the central portion of your dataset, making it a good choice for analyzing data with potential outliers or skewness.
Have a look at this video if you need to review how to calculate the interquartial range of a dataset.
Click on the following worksheet to get a printable pdf document.
Scroll down the page for more Interquartile Range Worksheets.
More Interquartile Range Worksheets
Printable
(Answers on the second page.)
Interquartile Range Worksheet #1 (step-by-step)
Interquartile Range Worksheet #2 (practice)
Interquartile Range Worksheet #3 (interpret)
Related Lessons & Worksheets
Try the free Mathway calculator and
problem solver below to practice various math topics. Try the given examples, or type in your own
problem and check your answer with the step-by-step explanations.

We welcome your feedback, comments and questions about this site or page. Please submit your feedback or enquiries via our Feedback page.
