Line Plot Worksheets
Related Pages
Math Worksheets
Lessons for Second Grade
Free Printable Worksheets
Common Core Math
Printable “Data Representation” worksheets:
Data Representation (First Grade)
Tally Charts
Picture Graphs
Bar Graphs
Scaled Bar Graphs
Line Plots
Line Plot Worksheets
Line plots allows second graders to visualize and understand data related to frequency or order.
- Start with small data sets involving familiar topics like plant heights, jump distances, or book lengths.
- Use a number line with clear markings and corresponding labels.
- Use simple marks like X’s to represent each data point.
- Discuss patterns and trends emerging from the line plot. Ask questions like: “Are there any numbers with more marks?” or “Do the marks generally get higher or lower?”
- Use the line plot to tell stories about the data. For example, “The tallest plant was 15 cm, and only two plants were shorter than 8 cm.”
Line plots can be a powerful tool for second graders to build a strong foundation in data visualization, pattern recognition, and storytelling with data.
Have a look at this video if you need to learn how to draw a line plot.
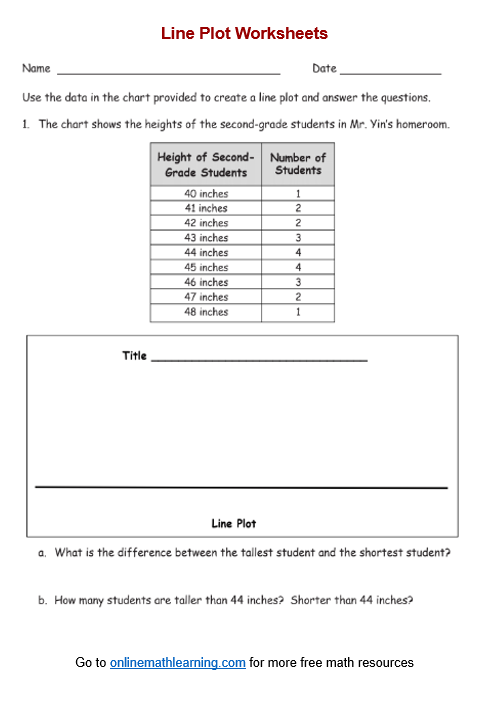
Click on the following worksheet to get a printable pdf document.
Scroll down the page for more Line Plot Worksheets.
More Line Plot Worksheets
(Answers on the second page)
Line Plot Worksheet #1
Line Plot Worksheet #2
Line Plot Worksheet #3
Line Plot Worksheet #4
Line Plot Worksheet #5
Line Plot Worksheet #6
Related Worksheets
Try out our new and fun Fraction Concoction Game.
Add and subtract fractions to make exciting fraction concoctions following a recipe. There are four levels of difficulty: Easy, medium, hard and insane. Practice the basics of fraction addition and subtraction or challenge yourself with the insane level.

We welcome your feedback, comments and questions about this site or page. Please submit your feedback or enquiries via our Feedback page.
