
Measures of Central Tendency & Variability
Videos and lessons with examples and solutions to help High School students learn how to use measures of center and measures of variability for numerical data from random samples to draw informal comparative inferences about two populations. For example, decide whether the words in a chapter of a seventh-grade science book are generally longer than the words in a chapter of a fourth-grade science book.
Related Topics:Grade 7 Common Core
Grade 7 Math Lessons
Common Core Mathematics
Common Core: 7.SP.4
Suggested Learning Targets
- I can make informal comparisons of data about two populations.
- I can compare two sets of data using measures of
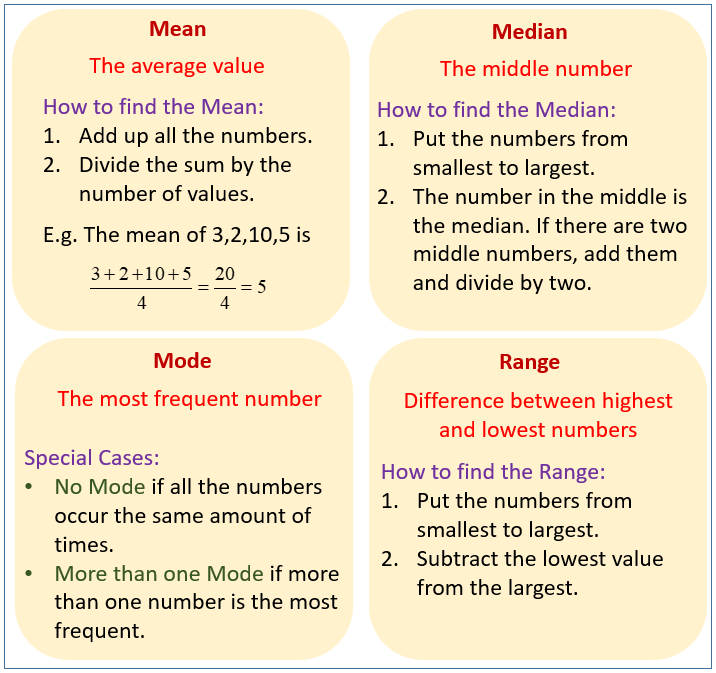
center (mean, median, mode) and measures
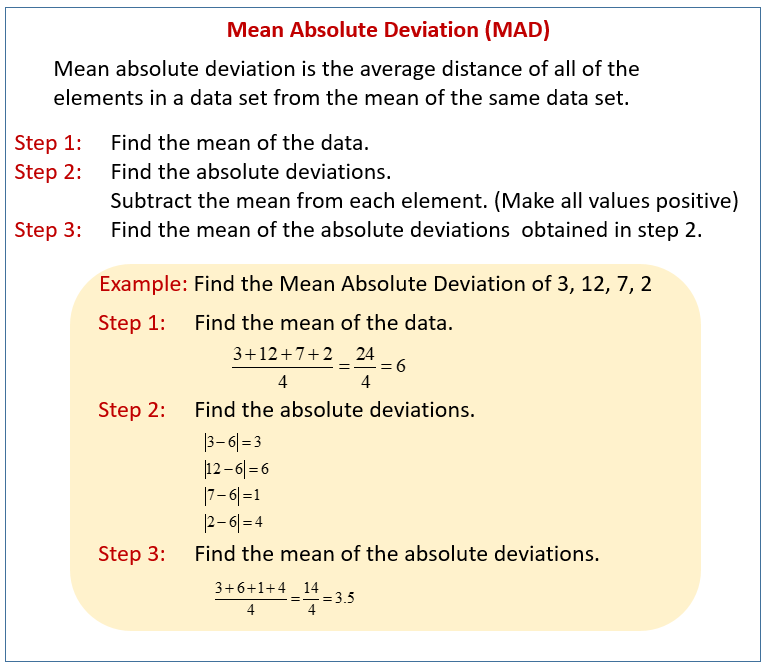
of variability (MAD and IQR).


Examples:
1. Find the mean, median and mode for the numbers 18, 22, 22, 17, 30, 18, 12
2. The mean score on a set of 20 tests is 75. What is the sum of the 20 test scores?
3. If the mean weight of seven linesmen on a team is 230 pounds and the mean weight of the four backfield members is 190 pounds, what is the mean weight of the 11-person team?
4. Create a box plot for the numbers below:
18, 22, 22, 17, 30, 18, 12
6. Find the mean absolute deviation, the variation and the standard deviation for
18, 22, 22, 17, 30, 18, 12
7. Assume a normal distribution and that the average phone call in a certain town lasted 4 minutes with a standard deviation of 2 minutes. What percentage of the calls lasted less than 2 minutes?
8. The mean IQ score for 1500 students is 100, with a standard deviation of 15. Assuming the scores have a normal curve
a) how many has an IQ between 85 and 115?
b) how many have an IQ between 70 and 130?
c) how many have an IQ over 145?
9. Junior was ranked 50th in his graduating class of 315 students. Liz was in the 50th percentile of this same graduating class. Which student had the higher GPA when they graduated?
Measures of Center
Examples:
Sarah wanted to figure out if she did better on tests by studying 2 more hours or by sleeping 2 more hours. She charted her results for 10 different tests. Based on the data, should Sarah study more or sleep more the night before a test? Range, variance and standard deviation as measures of dispersion
Try the free Mathway calculator and
problem solver below to practice various math topics. Try the given examples, or type in your own
problem and check your answer with the step-by-step explanations.


We welcome your feedback, comments and questions about this site or page. Please submit your feedback or enquiries via our Feedback page.