Measures of Variability
A series of free, online video lessons with examples and solutions to help Grade 7 students learn how to informally assess the degree of visual overlap of two numerical data distributions with similar variabilities, measuring the difference between the centers by expressing it as a multiple of a measure of variability.
Related Pages
Understanding Variability
Sampling Variability
Common Core Grade 7
Common Core Mathematics
Grade 7 Math
For example,
The mean height of players on the basketball team is 10 cm greater than the mean height
of players on the soccer team, about twice the variability (mean absolute deviation)
on either team; on a dot plot, the separation between the two distributions of heights
is noticeable.
Common Core: 7.SP.3
Suggested Learning Targets {#target)
- I can calculate the mean, range, and the mean absolute deviation (MAD) to compare two data sets (Note: MAD is the average distance between each value and the mean.)
- I can observe the overlap and differences of two data sets with similar variability.
- I can compare two data sets using the range or MAD.
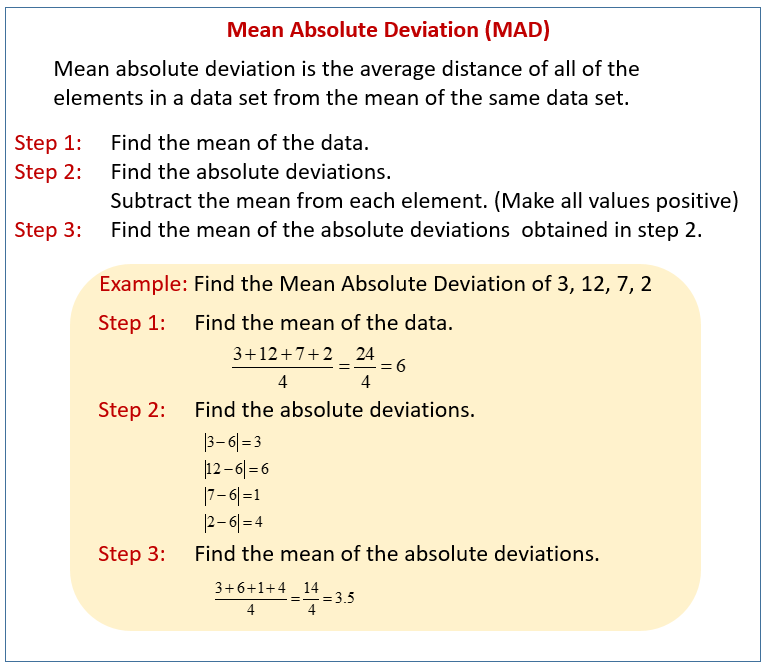
The following diagrams show how to calculate the Mean Absolute Deviation. Scroll down the page for examples and solutions on how to use the Mean Absolute Deviation.

Variability and Deviations from the Mean
Summarizing Deviations from the Mean.
- Variability describes how spread out the data is.
- For any given value in a data set, the deviation from the mean is the value minus the mean.
- The greater the variability (spread) of the distribution, the greater the deviations from the mean (ignoring the signs of the deviation).
A consumers' organization is planning a study of the various brands of batteries that are available.
As part of its planning, it measures lifetime (how long a battery van be used before it must be replaced)
for each of six batteries of Brand A and eight batteries of Brand B. Dot plots showing the battery
lives for each brand are shown below.
(a) Does one brand of battery tend to last longer or are they roughly the same? Justify your claim.
(b) What number could you calculate to compare the typical battery life of the two brands?
Introduction to Mean Absolute Deviation
This video explains what Mean Absolute Deviation is as well as how to calculate it.
Example:
Find the Mean Absolute Deviation of the data
2, 5, 7, 13, 18
Mean Absolute Deviation (MAD)
Review how to find the MAD or mean absolute deviation of a given data set.
What is Mean Absolute Deviation (MAD)?
Mean absolute deviation is the average distance of all of the elements in a data set
from the mean of the same data set.
- The MAD indicates how spread out your data set is.
- A large MAD indicates a data set that is more spread out in relation to the mean.
- A small MAD would indicate data that is less spread out and located closer to the mean.
Example:
A student scored the following percentages on 10 quizzes over the course of a semester:
55, 65, 70, 70, 72, 85, 90, 90, 93, 100
Find the MAD of the quiz scores.
Step 1: Find the mean of the given data set
Step 2: Find the distance that each element in your data set is away from the mean if it were on a number line. (subtract each element with the mean and use the absolute value because the distance is always positive)
Step 3: Calculate the mean of all of the values you had when subtracting.
Mean Absolute Deviation
This video reviews how to find Mean Absolute Deviation for a set of data.
One way to find out how consistent a set of data is to find the Mean Absolute Deviation. The Mean Absolute Deviation describes the average distance from the mean for the numbers in the data set.
Step 1: Find the mean of the data.
Step 2: Subtract the mean from each data point. (Make all values positive)
Step 3: Find the mean of the values you got when you subtracted in step 2.
Example:
Find the Mean Absolute Deviation of the following data
87, 94, 72, 65, 97, 77
Measures of Variability
Calculating the Range, IQR and MAD or Mean Absolute Deviation for ungrouped data.
Mean Absolute Deviation
This video describes how to calculate the mean absolute deviation of a data set with two examples.
Steps to find the MAD
- Calculate the mean of the data set.
- Find how far each point is from the mean.
- Take the absolute value of each difference.
- Calculate the mean of the differences.
Example:
Find the MAD of each of these data sets.
a) 5, 5, 6, 6, 6, 7, 7, 9, 9, 10
b) 1, 1, 2, 2, 3, 4, 7, 10, 12, 28
Try the free Mathway calculator and
problem solver below to practice various math topics. Try the given examples, or type in your own
problem and check your answer with the step-by-step explanations.

We welcome your feedback, comments and questions about this site or page. Please submit your feedback or enquiries via our Feedback page.