Normal Distribution
In these lessons, we learn the characteristics of the normal distribution and its applications.
Related Pages
Normal Distribution
Normal Distribution: Probability
Standard Deviation
More Lessons for Statistics
Math Worksheets
What is the Normal Distribution?
Probably the most widely known and used of all distributions is the normal distribution.
It fits many human characteristics, such as height, weight, speed etc. Many living things
in nature, such as trees, animals and insects have many characteristics that are normally
distributed. Many variables in business and industry are also normally distributed.
Discovery of the normal curve is generally credited to Karl Gauss (1777 – 1855), who recognized that the errors of repeated measurement of objects are often normally distributed. Sometimes, the normal distribution is also called the Gaussian distribution.
The normal distribution has the following characteristics:
- It is a continuous distribution
- It is symmetrical about the mean. Each half of the distribution is a mirror image of the other half.
- It is asymptotic to the horizontal axis. That is, it does not touch the x-axis and it goes on forever in each direction.
- It is unimodal. The normal curve is sometimes called a bell-shaped curve. All the values are “bunched up” in only one portion of the graph – the center of the curve.
- It is a family of curves. Every unique value of the mean and every unique value of the standard deviation result in a different normal curve.
- The area under the curve is 1. The area under the curve yields the probabilities, so the total of all probabilities for a normal distribution is 1. Since the distribution is symmetric, the area of the distribution on each side of the mean is 0.5.
What is the Probability density function of the normal distribution?
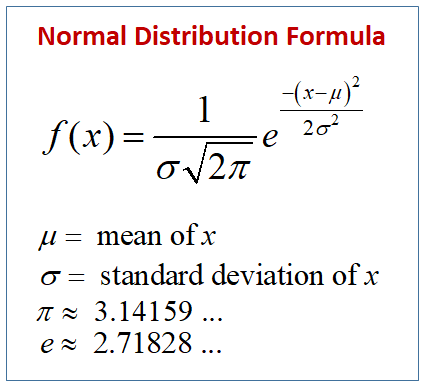
The normal distribution is described by two parameters: the mean, μ, and the
standard deviation, σ. We write X - N(μ, σ2).
The following diagram shows the formula for Normal Distribution. Scroll down the page for more examples and solutions on using the normal distribution formula.

Since the formula is so complex, using it to determine area under the curve is cumbersome and time consuming. Instead, tables and software are used to find the probabilities for the normal distribution. This will be discussed in the lesson on Z-Score.
Normal Distribution
The 68-95-99.7 Rule
- Approximately 68% of the data falls ±1 standard deviation from the mean.
- Approximately 95% of the data falls ±2 standard deviation from the mean.
- Approximately 99.7% of the data falls ±3 standard deviation from the mean.
Examples:
-
In a call center, the distribution of the number of phone calls answered each day by each of the 12 receptionists is bell-shaped and has a mean of 63 and a standard deviation of 3. Use the empirical rule, what is the approximate percentage of daily phone calls numbering between 60 and 66?
-
The scores of a midterm are normally distributed with a mean of 85% and a standard deviation of 6%. Find the percentage of the class that score above and below the given score. Use the 68-95-99.7 rule from the text.
a) Score: 91%
b) Score: 73%
The following video explores the normal distribution
Presentation on spreadsheet to show that the normal distribution approximates the binomial distribution for a large number of trials.
Try out our new and fun Fraction Concoction Game.
Add and subtract fractions to make exciting fraction concoctions following a recipe. There are four levels of difficulty: Easy, medium, hard and insane. Practice the basics of fraction addition and subtraction or challenge yourself with the insane level.

We welcome your feedback, comments and questions about this site or page. Please submit your feedback or enquiries via our Feedback page.