Illustrative Mathematics Unit 6.2, Lesson 15: Part-Part-Whole Ratios
Learning Targets:
- I can create tape diagrams to help me reason about problems involving a ratio and a total amount.
- I can solve problems when I know a ratio and a total amount.
Related Pages
Illustrative Math
Grade 6
Lesson 15: Part-Part-Whole Ratios
Let’s look at situations where you can add the quantities in a ratio together.
Illustrative Math Unit 6.2, Lesson 15 (printable worksheets)
Lesson 15 Summary
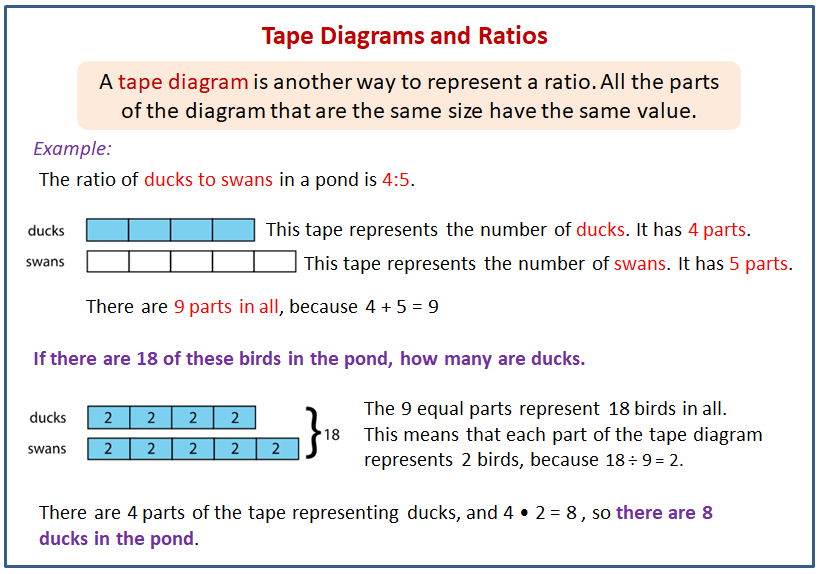
The following diagram shows how to use a tape diagram to represent a ratio.

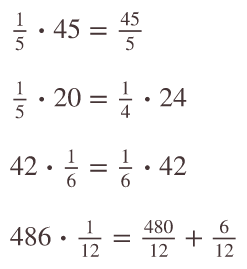
15.1 True or False: Multiplying by a Unit Fraction
True or false?
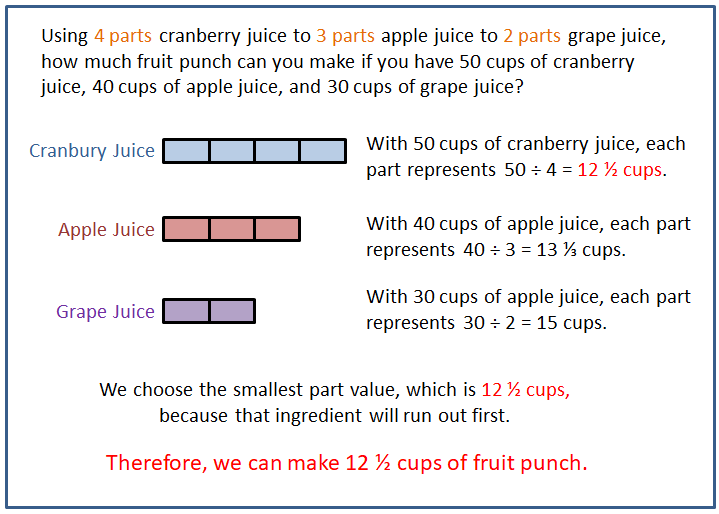
Scroll down the page for the solution to the fruit punch problem.
15.2 - Cubes of Paint
A recipe for maroon paint says, “Mix 5 ml of red paint with 3 ml of blue paint.”
- Use snap cubes to represent the amounts of red and blue paint in the recipe. Then, draw a sketch of your snap-cube representation of the maroon paint.
a. What amount does each cube represent?
b. How many milliliters of maroon paint will there be? - a. Suppose each cube represents 2 ml. How much of each color paint is there?
Red: _______ ml
Blue: _______ ml
Maroon: _______ ml
b. Suppose each cube represents 5 ml. How much of each color paint is there?
Red: _______ ml
Blue: _______ ml
Maroon: _______ ml - a. Suppose you need 80 ml of maroon paint. How much red and blue paint would you mix? Be prepared to explain your reasoning.
Red: _______ ml
Blue: _______ ml
Maroon: 80 ml
b. If the original recipe is for one batch of maroon paint, how many batches are in 80 ml of maroon paint?
15.3 - Sneakers, Chicken, and Fruit Juice
Solve each of the following problems and show your thinking. If you get stuck, consider drawing a tape diagram to represent the situation.
- The ratio of students wearing sneakers to those wearing boots is 5 to 6. If there are 33 students in the class, and all of them are wearing either sneakers or boots, how many of them are wearing sneakers?
- A recipe for chicken marinade says, “Mix 3 parts oil with 2 parts soy sauce and 1 part orange juice.” If you need 42 cups of marinade in all, how much of each ingredient should you use?
- Elena makes fruit punch by mixing 4 parts cranberry juice to 3 parts apple juice to 2 parts grape juice. If one batch of fruit punch includes 30 cups of apple juice, how large is this batch of fruit punch?
Are you ready for more?
Using the recipe from earlier, how much fruit punch can you make if you have 50 cups of cranberry juice, 40 cups of apple juice, and 30 cups of grape juice?
15.3 -Invent Your Own Ratio Problem
- Invent another ratio problem that can be solved with a tape diagram and solve it. If you get stuck, consider looking back at the problems you solved in the earlier activity.
- Create a visual display that includes:
- The new problem that you wrote, without the solution.
- Enough work space for someone to show a solution.
- Trade your display with another group, and solve each other’s problem. Include a tape diagram as part of your solution. Be prepared to share the solution with the class.
- When the solution to the problem you invented is being shared by another group, check their answer for accuracy.
Glossary Terms
tape diagram
A tape diagram is a group of rectangles put together to represent a relationship between quantities.
For example, this tape diagram shows a ratio of 30 gallons of yellow paint to 50 gallons of blue paint.
If each rectangle were labeled 5, instead of 10, then the same picture could represent the equivalent ratio of 15 gallons of yellow paint to 25 gallons of blue paint.
Lesson 15 Practice Problems
- Here is a tape diagram representing the ratio of red paint to yellow paint in a mixture of orange paint.
a. What is the ratio of yellow paint to red paint?
b. How many total cups of orange paint will this mixture yield? - At the kennel, the ratio of cats to dogs is . There are 27 animals in all. Here is a tape diagram representing this ratio.
a. What is the value of each small rectangle?
b. How many dogs are at the kennel?
c. How many cats are at the kennel? - Last month, there were 4 sunny days for every rainy day. If there were 30 days in the month, how many days were rainy? Explain your reasoning. If you get stuck, consider using a tape diagram.
- Noah entered a 100-mile bike race. He knows he can ride 32 miles in 160 minutes. At this rate, how long will it take him to finish the race? Use each table to find the answer. Next, explain which table you think works better in finding the answer.
Table A:
| distance (miles) | elapsed time (minutes) |
| 32 | 160 |
| 1 | |
| 100 |
| distance (miles) | elapsed time (minutes) |
| 32 | 160 |
| 96 | |
| 4 | |
| 100 |
b. How much does the cashier earn if she works 3 hours?
6. A grocery store sells bags of oranges in two different sizes.
- The 3-pound bags of oranges cost $4.
- The 8-pound bags of oranges for $9.
Which oranges cost less per pound? Explain or show your reasoning.
The Open Up Resources math curriculum is free to download from the Open Up Resources website and is also available from Illustrative Mathematics.
Try out our new and fun Fraction Concoction Game.
Add and subtract fractions to make exciting fraction concoctions following a recipe. There are four levels of difficulty: Easy, medium, hard and insane. Practice the basics of fraction addition and subtraction or challenge yourself with the insane level.

We welcome your feedback, comments and questions about this site or page. Please submit your feedback or enquiries via our Feedback page.


