Illustrative Mathematics Grade 8, Unit 6, Lesson 2: Plotting Data
Learning Targets:
- I can draw a scatter plot to show data that has two paired variables.
Related Pages
Illustrative Math
Grade 8
Lesson 2: Plotting Data
Let’s collect and display some data about the class.
Illustrative Math Unit 8.6, Lesson 2 (printable worksheets)
Lesson 2 Summary
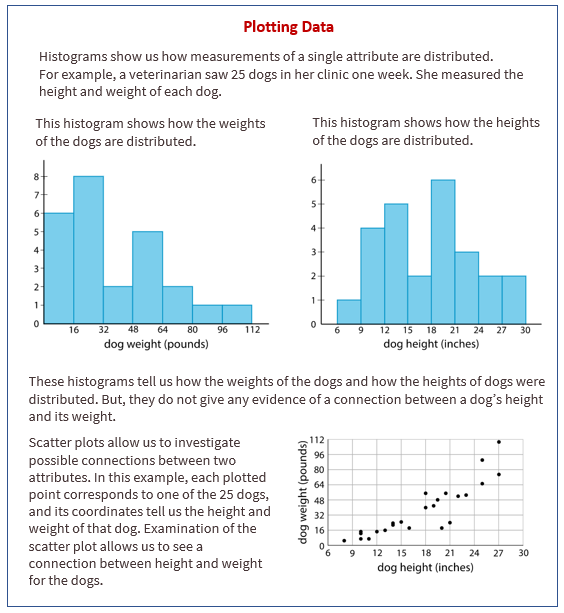
The following diagram shows how to draw a scatter plot to show data that has two paired variables.

Lesson 2.1 Representing Data
Lin surveyed 30 students about the longest time they had ever run. Andre asked them about their favorite color. How could Lin and Andre represent their data sets? Would they represent them in the same way? Why or why not?
Lesson 2.2 Gathering Data
Are older students always taller? Do taller students tend to have bigger hands? To investigate these questions, the class will gather data.
- A person’s arm span is the distance between the tips of their index fingers, when their arms are fully spread out.
- A person’s hand span is the distance from the tip of their thumb to the tip of their little finger, when their fingers are fully spread out.
- Each partner should:
- Measure the other partner’s height, arm span, and hand span for their right hand to the nearest centimeter.
- Record the other partner’s measurements and age (in months) in the table.
- One partner records the data from your table in a table of data for the entire class.
Lesson 2.3 Scatter Plots
- What types of graphical representations could be used to show the class’s height measurements? Make a graphical representation of the class’s height measurements using these directions for the applet:
- Enter the class height data in column A. Note: enter only one value in each cell, just the height of each student.
- Click on the column header to highlight it.
- Select the One-Variable Analysis tool (the one that looks like a histogram), and a new frame will appear.
- Drag the window open and you will see a histogram of the data.
- Change the type of graph by choosing from the drop-down menu.
Open Applet
- Make a scatter plot of the heights and hand spans of each student in your class. Enter the class height data into one column and the corresponding hand span data into the other column. The points will appear on the graph as you type them in. To see more of the graph after you have entered in the data, click the double left arrows to minimize the data view.
Open Applet - Based on your scatter plot, answer these questions:
a. Do taller students in your class tend to have bigger hands? Explain how you know.
b. Is hand span a linear function of height? Explain how you know.
Are you ready for more?
Although the data may be accurate, displaying the data incorrectly can tell the wrong story. What is wrong with each of these graphic representations of the data?
Lesson 2.4 Same Function, Different Rule?
Which input-output rules could describe the same function (if any)? Be prepared to explain your reasoning.
Lesson 2 Practice Problems
- In hockey, a player gets credited with a “point” in their statistics when they get an assist or goal. The table shows the number of assists and number of points for 15 hockey players after a season.
Make a scatter plot of this data. Make sure to scale and label the axes. - Select all the representations that are appropriate for comparing bite strength to weight for different carnivores.
A. Histogram
B. Scatter plot
C. Dot plot
D. Table
e. Box plot - When is it better to use a table? When is it better to use a scatter plot?
- There are many cylinders with radius 6 meters. Let h represent the height in meters and V represent the volume in cubic meters.
a. Write an equation that represents the volume V as a function of the height h.
b. Sketch the graph of the function, using 3.14 as an approximation for π.
c. If you double the height of a cylinder, what happens to the volume? Explain this using the equation.
d. If you multiply the height of a cylinder by 1/3, what happens to the volume? Explain this using the graph.
The Open Up Resources math curriculum is free to download from the Open Up Resources website and is also available from Illustrative Mathematics.
Try out our new and fun Fraction Concoction Game.
Add and subtract fractions to make exciting fraction concoctions following a recipe. There are four levels of difficulty: Easy, medium, hard and insane. Practice the basics of fraction addition and subtraction or challenge yourself with the insane level.

We welcome your feedback, comments and questions about this site or page. Please submit your feedback or enquiries via our Feedback page.