Probability and Statistics
Related Pages:
Probability
Statistics and Probability
Statistics Lectures
Probability problems may involve interpreting statistical data and statistics often involve the consideration of probability.
Example:
40 students were given a test. The table below shows the cumulative frequency of the results obtained.
Mark |
10 |
20 |
30 |
40 |
50 |
60 |
70 |
80 |
90 |
100 |
Number of students scoring the mark or less |
2 |
5 |
8 |
11 |
18 |
24 |
30 |
32 |
37 |
40 |
a) State the probability that a student chosen at random will have a mark less than or equal to 60.
b) Two students are chosen at random from the 40 students. Find the probability that neither have marks more than 60.
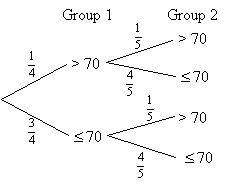
c) A second group of students were tested and one-fifth of them scored more than 70 marks. If a student is now chosen at random from each group, find the probability that at least one student would have scored more than 70.
Solution:
a) From the table, we see that there were 24 students who scored 60 marks or less. Therefore, the probability of selecting a student with 60 marks or less ![]()
b) Neither have marks more than 60 means that both have marks less than or equal to 60.
Probability = ![]()
c) From the table, we can work out that there are 40 – 30 = 10 students with greater than 70 marks. Therefore, the probability of selecting a student in the first with greater than 70 marks ![]()

Probability that at least one student would have scored more than 70 is
Introduction to Probability and Statistics
Introduce the basic definitions and nomenclature of probability and statistics.
Definition of Sets and Elements
Definition of Sample Spaces & Factorials
Definition of Event
Link to the Probability & Statistics Playlist
Try the free Mathway calculator and
problem solver below to practice various math topics. Try the given examples, or type in your own
problem and check your answer with the step-by-step explanations.

We welcome your feedback, comments and questions about this site or page. Please submit your feedback or enquiries via our Feedback page.