Illustrative Mathematics Unit 6.6, Lesson 16: Two Related Quantities, Part 1
Learning Targets:
- I can create tables and graphs that show the relationship between two amounts in a given ratio.
- I can write an equation with variables that shows the relationship between two amounts in a given ratio.
Related Pages
Illustrative Math
Grade 6
Lesson 16: Two Related Quantities, Part 1
Let’s use equations and graphs to describe relationships with ratios.
Illustrative Math Unit 6.6, Lesson 16 (printable worksheets)
Lesson 16 Summary
In this lesson, we will learn how to use equations and graphs to describe relationships with ratios.
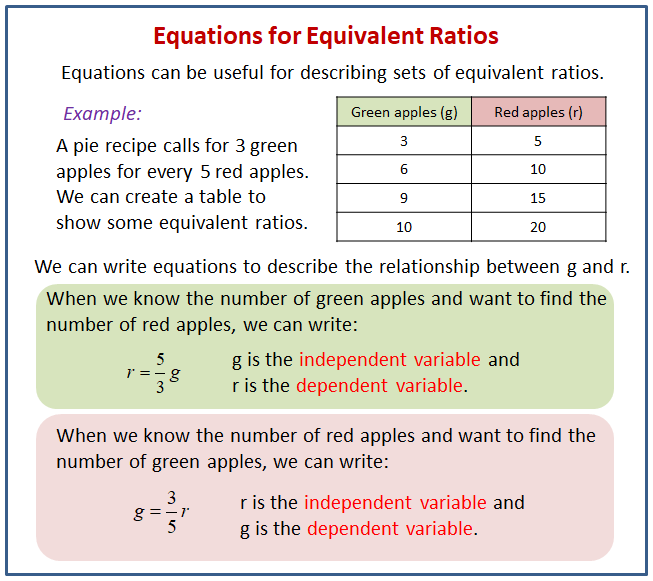
The following diagram shows how to use tables and equations to describe sets of equivalent ratios.

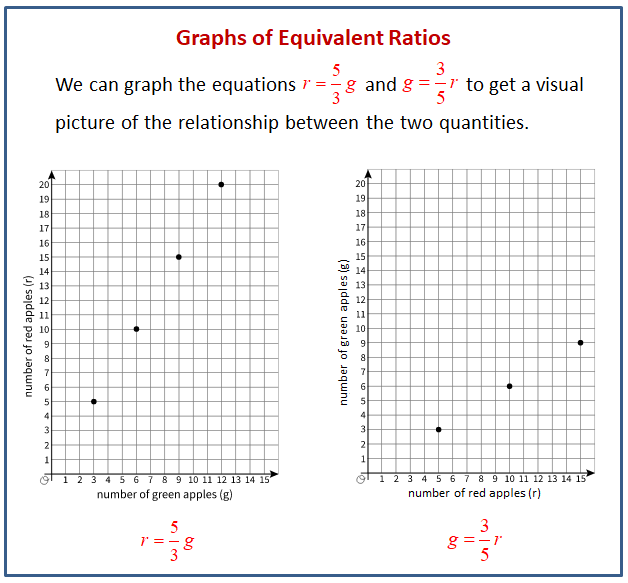
The following diagram shows how to use graphs to get a visual picture of the relationship between the two quantities.

Lesson 16.1 Which One Would You Choose?
Which one would you choose? Be prepared to explain your reasoning.
- A 5-pound jug of honey for $15.35
- Three 1.5-pound jars of honey for $13.05
Scroll down the page for the solutions to the “Are you ready for more?” section.
Lesson 16.2 Painting the Set
Lin needs to mix a specific color of paint for the set of the school play. The color is a shade of orange that uses 3 parts yellow for every 2 parts red.
- Complete the table to show different combinations of red and yellow paint that will make the shade of orange Lin needs.
| cups of red paint(r) | cups of yellow paint(y) | total cups of paint(t) |
| 2 | 3 | |
| 6 | ||
| 20 | ||
| 18 | ||
| 14 | ||
| 16 | ||
| 50 | ||
| 42 |
2. Lin notices that the number of cups of red paint is always 2/5 of the total number of cups. She writes the equation r = 2/5 t to describe the relationship. Which is the independent variable? Which is the dependent variable? Explain how you know. 3. Write an equation that describes the relationship between and where is the independent variable. 4. Write an equation that describes the relationship between and where is the independent variable. 5. Use the points in the table to create two graphs that show the relationship between and . Match each relationship to one of the equations you wrote.
Are you ready for more?
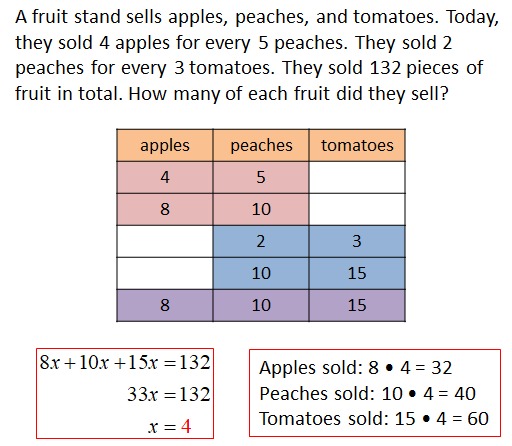
A fruit stand sells apples, peaches, and tomatoes. Today, they sold 4 apples for every 5 peaches. They sold 2 peaches for every 3 tomatoes. They sold 132 pieces of fruit in total. How many of each fruit did they sell?
Glossary Terms
dependent variable
The dependent variable is the result of a calculation.
For example, a boat travels at a constant speed of 25 miles per hour. The equation d = 25t describes the relationship between the boat’s distance and time. The dependent variable is the distance traveled, because d is the result of multiplying 25 by t.
independent variable
The independent variable is used to calculate the value of another variable.
For example, a boat travels at a constant speed of 25 miles per hour. The equation d = 25t describes the relationship between the boat’s distance and time. The independent variable is time, because t is multiplied by 25 to get d.
Lesson 16.3 Exponent Experimentation
A fruit stand sells apples, peaches, and tomatoes. Today, they sold 4 apples for every 5 peaches. They sold 2 peaches for every 3 tomatoes. They sold 132 pieces of fruit in total. How many of each fruit did they sell?
Lesson 16 Practice Problems
- Here is a graph that shows some values for the number of cups of sugar, s, required to make x batches of brownies.
a. Complete the table so that the pair of numbers in each column represents the coordinates of a point on the graph.
b. What does the point (8,4) mean in terms of the amount of sugar and number of batches of brownies?
c. Write an equation that shows the amount of sugar in terms of the number of batches. - Each serving of a certain fruit snack contains 90 calories.
a. Han wants to know how many calories he gets from the fruit snacks. Write an equation that shows the number of calories, c, in terms of the number of servings, n.
b. Tyler needs some extra calories each day during his sports season. He wants to know how many servings he can have each day if all the extra calories come from the fruit snack. Write an equation that shows the number of servings, n, in terms of the number of calories, c. - Kiran shops for books during a 20% off sale.
a. What percent of the original price of a book does Kiran pay during the sale?
b. Complete the table to show how much Kiran pays for books during the sale.
c. Write an equation that relates the sale price, s, to the original price p.
d. On graph paper, create a graph showing the relationship between the sale price and the original price by plotting the points from the table.
The Open Up Resources math curriculum is free to download from the Open Up Resources website and is also available from Illustrative Mathematics.
Try the free Mathway calculator and
problem solver below to practice various math topics. Try the given examples, or type in your own
problem and check your answer with the step-by-step explanations.

We welcome your feedback, comments and questions about this site or page. Please submit your feedback or enquiries via our Feedback page.
