Illustrative Mathematics Grade 8, Unit 8, Lesson 8: Finding Unknown Side Lengths
Learning Targets:
- If I know the lengths of two sides, I can find the length of the third side in a right triangle.
- When I have a right triangle, I can identify which side is the hypotenuse and which sides are the legs.
Related Pages
Illustrative Math
Grade 8
Lesson 8: Finding Unknown Side Lengths
Let’s find missing side lengths of right triangles.
Illustrative Math Unit 8.8, Lesson 8 (printable worksheets)
Lesson 8 Summary
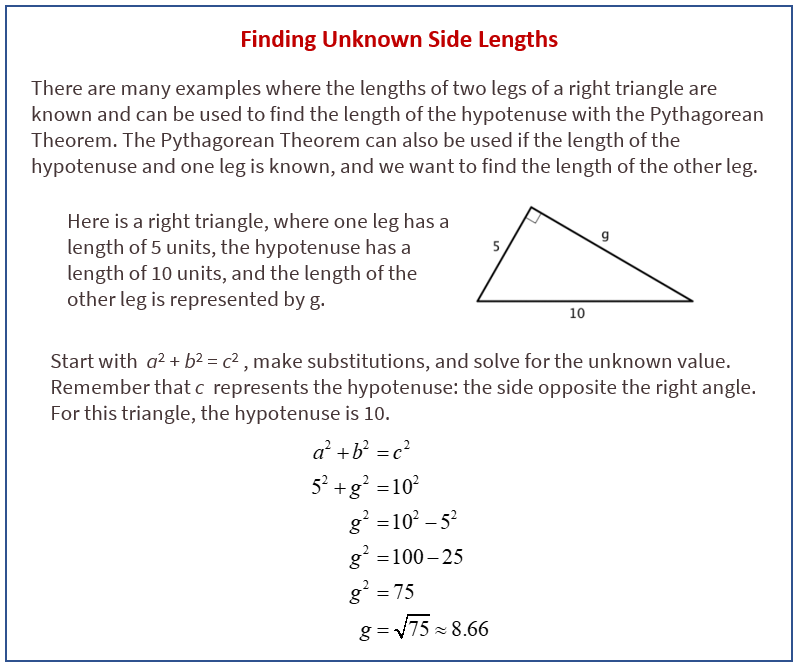
The following diagram shows how to find missing side lengths of right triangles.

Lesson 8.1 Which One Doesn’t Belong: Equations
Which one doesn’t belong?
Lesson 8.2 Which One Is the Hypotenuse?
Label all the hypotenuses with c.
Lesson 8.3 Find the Missing Side Lengths
- Find c.
- Find b.
- A right triangle has sides of length 2.4 cm and 6.5 cm. What is the length of the hypotenuse?
- A right triangle has a side of length 1/4 and a hypotenuse of length 1/3. What is the length of the other side?
- Find the value of x in the figure.
Are you ready for more?
The spiral in the figure is made by starting with a right triangle with both legs measuring one unit each. Then a second right triangle is built with one leg measuring one unit, and the other leg being the hypotenuse of the first triangle. A third right triangle is built on the second triangle’s hypotenuse, again with the other leg measuring one unit, and so on.
Find the length, x, of the hypotenuse of the last triangle constructed in the figure.
Lesson 8 Practice Problems
- Find the exact value of each variable that represents a side length in a right triangle.
- A right triangle has side lengths of a, b, and c units. The longest side has a length of c units. Complete each equation to show three relations among a, b, and c.
- What is the exact length of each line segment? Explain or show your reasoning. (Each grid square represents 1 square unit.)
- In 2015, there were roughly 1 × 10² high school football players and 2 × 10³ professional football players in the United States. About how many times more high school football players are there? Explain how you know.
- Evaluate:
- Here is a scatter plot of weight vs. age for different Dobermans. The model, represented by y = 2.45x + 1.22, is graphed with the scatter plot. Here, x represents age in weeks, and y represents weight in pounds.
a. What does the slope mean in this situation?
b. Based on this model, how heavy would you expect a newborn Doberman to be?
The Open Up Resources math curriculum is free to download from the Open Up Resources website and is also available from Illustrative Mathematics.
Try the free Mathway calculator and
problem solver below to practice various math topics. Try the given examples, or type in your own
problem and check your answer with the step-by-step explanations.

We welcome your feedback, comments and questions about this site or page. Please submit your feedback or enquiries via our Feedback page.