Scaled Bar Graph Worksheets
Related Pages
Math Worksheets
Lessons for Third Grade
Free Printable Worksheets
Printable “Data Representation” worksheets:
Tally Charts
Picture Graphs
Bar Graphs
Scaled Bar Graphs
Line Plots
Scaled Bar Graph Worksheets
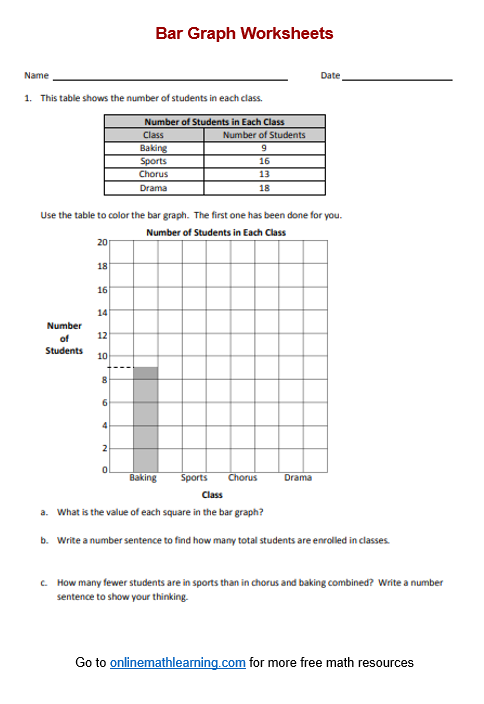
In these free math worksheets, you will learn how to create and use scaled bar graphs.
- Create scaled bar graphs.
- Solve one- and two-step problems involving graphs.
How to create and use scaled bar graphs?
Creating and using scaled bar graphs involves representing data in a visual format using bars of different lengths to represent the quantities of the data.
- Start with a set of data that you want to represent. This could be numerical values representing different categories or groups.
- Identify the categories or groups that the data belongs to. Determine the scale of your graph based on the range of values in your data. Choose a suitable scale that allows you to represent all the data clearly on the graph.
- Draw a horizontal axis (x-axis) to represent the categories or groups. Draw a vertical axis (y-axis) to represent the values of the data. Label the axes appropriately.
- On the y-axis, mark scale intervals based on the chosen scale. Ensure that the intervals are evenly spaced and appropriate for the range of values in your data.
- For each category on the x-axis, draw a vertical bar that extends up to the corresponding value on the y-axis. The length of the bar represents the quantity of the data.
- Label each bar with the corresponding value it represents. This helps readers interpret the graph accurately.
- Interpret the graph by comparing the lengths of the bars. Longer bars indicate larger quantities, while shorter bars indicate smaller quantities.
Have a look at this video if you need to learn how create and interpret scaled bar graphs.
Click on the following worksheet to get a printable pdf document.
Scroll down the page for more Scaled Bar Graph Worksheets.
More Scaled Bar Graph Worksheets
Printable
(Answers on the second page.)
Scaled Bar Graph Worksheet #1
Scaled Bar Graph Worksheet #2
Scaled Bar Graph Worksheet #3
Scaled Bar Graph Worksheet #4
Related Lessons & Worksheets
Mean
Median
Mode
Range
Mean, Median, Mode
Try out our new and fun Fraction Concoction Game.
Add and subtract fractions to make exciting fraction concoctions following a recipe. There are four levels of difficulty: Easy, medium, hard and insane. Practice the basics of fraction addition and subtraction or challenge yourself with the insane level.

We welcome your feedback, comments and questions about this site or page. Please submit your feedback or enquiries via our Feedback page.
