Illustrative Mathematics Grade 8, Unit 6, Lesson 7: Observing More Patterns in Scatter Plots
Learning Targets:
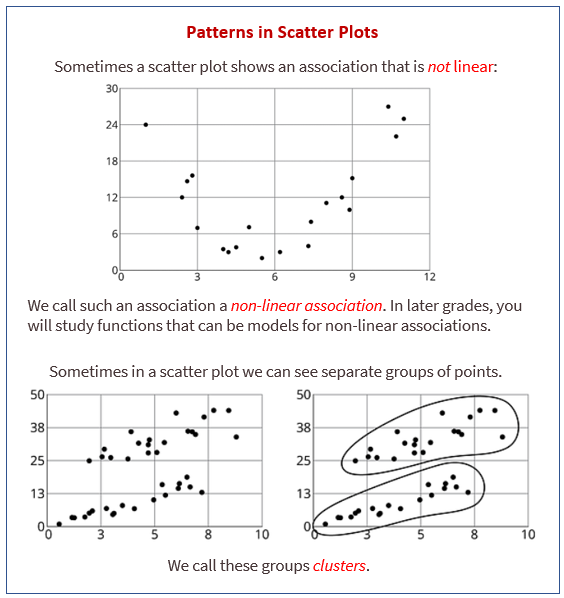
- I can pick out clusters in data from a scatter plot.
- I can use a scatter plot to decide if two variables have a linear association.
Related Pages
Illustrative Math
Grade 8
Lesson 7: Observing More Patterns in Scatter Plots
Let’s look for other patterns in data.
Illustrative Math Unit 8.6, Lesson 7 (printable worksheets)
Lesson 7 Summary
The following diagram shows how to use a scatter plot to decide if two variables have a linear association.

Lesson 7.1 Notice and Wonder: Nonlinear Scatter Plot
What do you notice? What do you wonder?
Lesson 7.2 Scatter Plot City
Your teacher will give you a set of cards. Each card shows a scatter plot.
- Sort the cards into categories and describe each category.
- Explain the reasoning behind your categories to your partner. Listen to your partner’s reasoning for their categories.
- Sort the cards into two categories: positive associations and negative associations. Compare your sorting with your partner’s and discuss any disagreements.
- Sort the cards into two categories: linear associations and non-linear associations. Compare your sorting with your partner’s and discuss any disagreements.
Lesson 7.3 Clustering
How are these scatter plots alike? How are they different?
Lesson 7 Practice Problems
- Literacy rate and population for the 12 countries with more than 100 million people are shown in the scatter plot. Circle any clusters in the data.
- Here is a scatter plot:
- Select all the following that describe the association in the scatter plot:
a. Linear association
b. Non-linear association
c. Positive association
d. Negative association
e. No association - For the same data, two different models are graphed. Which model more closely matches the data?
Explain your reasoning. - Here is a scatter plot of data for some of the tallest mountains on Earth.
The heights in meters and year of first recorded ascent is shown. Mount Everest is the tallest mountain in this set of data.
a. Estimate the height of Mount Everest.
b. Estimate the year of the first recorded ascent of Mount Everest. - A cone has a volume V, radius r, and a height of 12 cm.
a. A cone has the same height and 1/3 of the radius of the original cone. Write an expression for its volume.
b. A cone has the same height and 3 times the radius of the original cone. Write an expression for its volume.
The Open Up Resources math curriculum is free to download from the Open Up Resources website and is also available from Illustrative Mathematics.
Try the free Mathway calculator and
problem solver below to practice various math topics. Try the given examples, or type in your own
problem and check your answer with the step-by-step explanations.

We welcome your feedback, comments and questions about this site or page. Please submit your feedback or enquiries via our Feedback page.