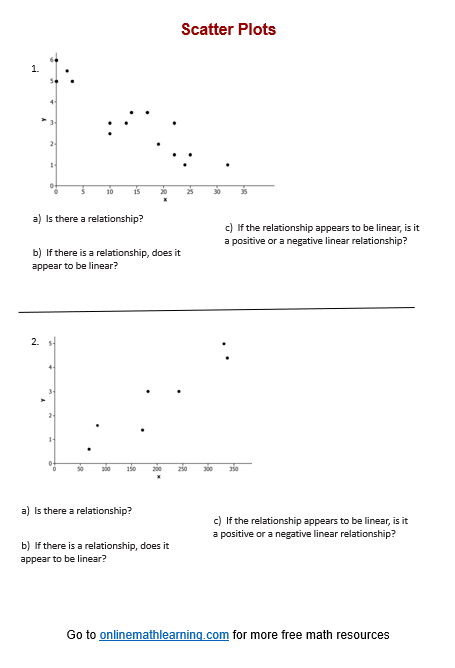
Scatter Plots Worksheets
Related Topics:
More Math Worksheets
More Printable Math Worksheets
More Grade 7 Math Lessons
Grade 8 Math Worksheets
Printable “Statistics” worksheets:
Statistical Questions
Categorical vs. Numerical Data
Create Dot Plots
Interpret Dot Plots
Histograms
Relative Frequency Histograms
Scatter Plots
Two-Way Tables
Examples, solutions, videos, and worksheets to help Grade 7 and Grade 8 students learn to distinguish linear patterns from nonlinear patterns based on scatter plots. Describe positive and negative trends in a scatter plot. Identify and describe unusual features in scatter plots, such as clusters and outliers.
Scatter Plots
A scatter plot is a graphical representation that displays the relationship between two numerical variables. Each data point is represented by a dot on the graph, where the position of the dot is determined by the values of the two variables.
Key components of a scatter plot:
X-axis: Represents the independent variable.
Y-axis: Represents the dependent variable.
Data points: Dots that represent individual data points.
A scatter plot might show a linear relationship, a nonlinear relationship, or no relationship.
By examining the pattern of the dots on the scatter plot, you can identify different types of relationships between the variables:
Positive correlation: As the values of one variable increase, the values of the other variable also tend to increase.
Negative correlation: As the values of one variable increase, the values of the other variable tend to decrease.
No correlation: There is no clear relationship between the variables.
Line of best fit: A line that can be drawn through the data points to represent the overall trend.
Outliers in a scatter plot are unusual points that do not seem to fit the general pattern in the plot or that are far away from the other points in the scatter plot.
Clusters occur when the points in the scatter plot appear to form two or more distinct clouds of points.
Have a look at this video if you need to review Patterns in Scatter Plots.
Click on the following worksheet to get a printable pdf document.
Scroll down the page for more Scatter Plots Worksheets.
More Scatter Plots Worksheets
Printable
(Answers on the second page.)
Positive, Negative or No Relationship
Scatter Plots Worksheet #1
Scatter Plots Worksheet #2
Scatter Plots Worksheet #3
Scatter Plots Worksheet #4
Include Outliers & Clusters
Scatter Plots Worksheet #5
Scatter Plots Worksheet #6
Scatter Plots Worksheet #7
Related Lessons & Worksheets
Patterns in Scatter Plots
More Printable Worksheets
Try the free Mathway calculator and
problem solver below to practice various math topics. Try the given examples, or type in your own
problem and check your answer with the step-by-step explanations.

We welcome your feedback, comments and questions about this site or page. Please submit your feedback or enquiries via our Feedback page.
