Illustrative Mathematics Grade 8, Unit 6, Lesson 6: The Slope of a Fitted Line
Learning Targets:
- I can use the slope of a line fit to data in a scatter plot to say how the variables are connected in real-world situations.
Related Pages
Illustrative Math
Grade 8
Lesson 6: The Slope of a Fitted Line
Let’s look at how changing one variable changes another.
Illustrative Math Unit 8.6, Lesson 6 (printable worksheets)
Lesson 6 Summary
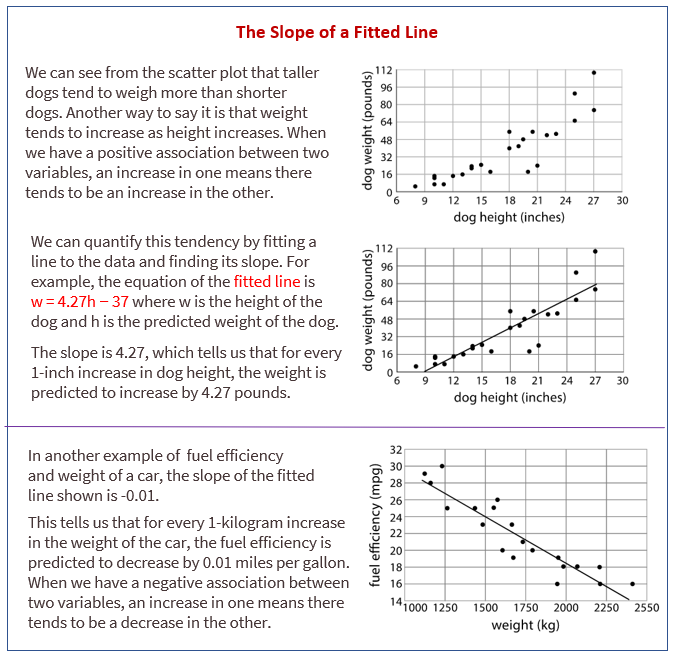
The following diagram shows how to use the slope of a line fit to data in a scatter plot to say how the variables are connected in real-world situations.

Lesson 6.1 Estimating Slope
Estimate the slope of the line.
Lesson 6.2 Describing Linear Associations
For each scatter plot, decide if there is an association between the two variables, and describe the situation using one of these sentences:
- For these data, as __________ increases, ___________ tends to increase.
- For these data, as __________ increases, ___________ tends to decrease.
- For these data, ___________ and ___________ do not appear to be related.
Lesson 6.3 Interpreting Slopes
For each of the situations, a linear model for some data is shown.
- What is the slope of the line in the scatter plot for each situation?
- What is the meaning of the slope in that situation?
Are you ready for more?
The scatter plot shows the weight and fuel efficiency data used in an earlier lesson along with a linear model represented by the equation y = -0.0114x + 41.3021
- What is the value of the slope and what does it mean in this context?
- What does the other number in the equation represent on the graph? What does it mean in context?
- Use the equation to predict the fuel efficiency of a car that weighs 100 kilograms.
- Use the equation to predict the weight of a car that has a fuel efficiency of 22 mpg.
- Which of these two predictions probably fits reality better? Explain.
Lesson 6.4 Positive or Negative?
- For each of the scatter plots, decide whether it makes sense to fit a linear model to the data. If it does, would the graph of the model have a positive slope, a negative slope, or a slope of zero?
- Which of these scatter plots show evidence of a positive association between the variables? Of a negative association? Which do not appear to show an association?
Lesson 6 Practice Problems
- Which of these statements is true about the data in the scatter plot?
- Here is a scatter plot that compares hits to at bats for players on a baseball team.
Describe the relationship between the number of at bats and the number of hits using the data in the scatter plot. - The linear model for some butterfly data is given by the equation . Which of the following best describes the slope of the model?
- Nonstop, one-way flight times from O’Hare Airport in Chicago and prices of a one-way ticket are shown in the scatter plot.
- Solve:
The Open Up Resources math curriculum is free to download from the Open Up Resources website and is also available from Illustrative Mathematics.
Try the free Mathway calculator and
problem solver below to practice various math topics. Try the given examples, or type in your own
problem and check your answer with the step-by-step explanations.

We welcome your feedback, comments and questions about this site or page. Please submit your feedback or enquiries via our Feedback page.