Solubility Curves
A series of free IGCSE Chemistry Activities and Experiments (Cambridge IGCSE Chemistry). These lessons look into the solubility curve.
Related Pages
More Lessons for IGCSE Chemistry
Math Worksheets
Effects of Temperature on Solubility
Saturated solution - When a maximum amount of the solute is dissolved.
Unsaturated solution - When less than a maximum amount of the solute is dissolved.
When saturation has been reached - Rate of dissolving = Rate of crystalisation.
Interpreting Solubility Curves How to read a solubility curve?
Example:
Refer to graph to answer the following questions:
- What mass of Ammonium Chloride will dissolve at 50°C in 100 g of water?
- What is less soluble in 100 g of water at 10°C sodium nitrate or sodium chloride?
- Will 100 g of potassium nitrate at 50°C in 100 g of water create a saturated solution? or unsaturated solution?
- 10 g of which substance will dissolve at 90°C in 100 g of water?
Exercise:
Refer to graph to answer the following questions:
- What mass of Sodium Chloride will dissolve at 90°C in 100 g of water?
- What mass of Potassium Nitrate will dissolve at 20°C in 100 g of water?
- What mass of Potassium Chromate will dissolve at 50°C in 200 g of water?
- What temperature is necessary for 65 g of lead nitrate to dissolve in 100 g of water?
- What temperature is necessary for 10 g of cerium sulfate to dissolve in 100 g of water?
- in 100 g of water at 60°C will 50 g of potassium chloride be saturated or unsaturated?
Questions:
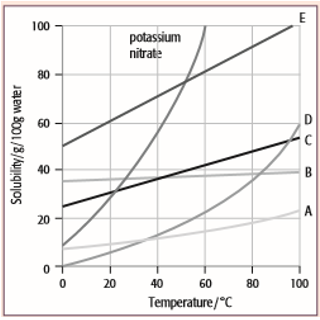
The solubility curves for potassium nitrate and five solids, A, B, C, D and E, are shown for the temperature range 0°C to 100°C. The solubility is given in grams of the solid that will dissolve in 100 grams of water.

For each question, select from the graph the letter A, B, C, D or E that represents the solid described. (Each letter may be used once, more than once or not at all.)
- Which solid has the lowest solubility at 60°C?
- Which solid has the same solubility as potassium nitrate at 52°C?
- Which solid has a solubility that changes least with temperature?
- Which solid would give a deposit of 20 g if a saturated solution in 100 g of water at 60°C was cooled to 20°C?
- Which solid would be deposited in the greatest mass if a saturated solution in 100 g of water at 100°C was cooled to 80°C?
Answers
- A
- F
- B
- E
- D
Try the free Mathway calculator and
problem solver below to practice various math topics. Try the given examples, or type in your own
problem and check your answer with the step-by-step explanations.

We welcome your feedback, comments and questions about this site or page. Please submit your feedback or enquiries via our Feedback page.