
Straight Line Graphs
Related Topics:
More Lessons GCSE Maths
Math Worksheets
Examples, videos, solutions, activities and worksheets that are suitable for GCSE Maths.
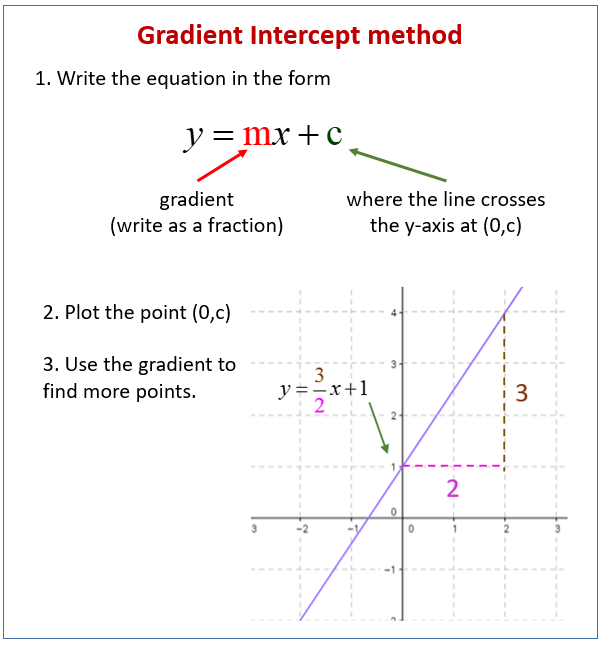
The following diagram shows how to graph a line using the gradient intercept method. Scroll down the page for more examples and solutions drawing a straight line graph using the gradient intercept method.
Write the equation of the line in the form y = mx + c.
c is the intercept and tells you the point where the line crosses the y axis.
m is the gradient and tells you how many squares up or down your go for every unit increase in x. If m is positive the line goes up and if m is negative the line goes down.
For example, the graph y = 2x - 5 crosses the y axis at (0,-5). The gradient is 2 (m = 2) so for every square right you can go up 2 squares. So you can plot points at (1,-3), (2,-1),(3,1)
GCSE Tutorial, Straight Line Graphs, linear equations, y = mx + c
Sketching Straight Line Graphs, basic linear functions


More Lessons GCSE Maths
Math Worksheets
Examples, videos, solutions, activities and worksheets that are suitable for GCSE Maths.
The following diagram shows how to graph a line using the gradient intercept method. Scroll down the page for more examples and solutions drawing a straight line graph using the gradient intercept method.

Write the equation of the line in the form y = mx + c.
c is the intercept and tells you the point where the line crosses the y axis.
m is the gradient and tells you how many squares up or down your go for every unit increase in x. If m is positive the line goes up and if m is negative the line goes down.
For example, the graph y = 2x - 5 crosses the y axis at (0,-5). The gradient is 2 (m = 2) so for every square right you can go up 2 squares. So you can plot points at (1,-3), (2,-1),(3,1)
Try out our new and fun Fraction Concoction Game.
Add and subtract fractions to make exciting fraction concoctions following a recipe. There are four levels of difficulty: Easy, medium, hard and insane. Practice the basics of fraction addition and subtraction or challenge yourself with the insane level.


We welcome your feedback, comments and questions about this site or page. Please submit your feedback or enquiries via our Feedback page.