Systems of Equations - Graphical Method
Related Pages
Solving Equations
Solve Systems of Equations by Substitution
Solve Systems of Equations by Addition
More Algebra Lessons
In these lessons, we will learn how to solve systems of equations or simultaneous equations by graphing.
How to solve System of Equations by Graphing?
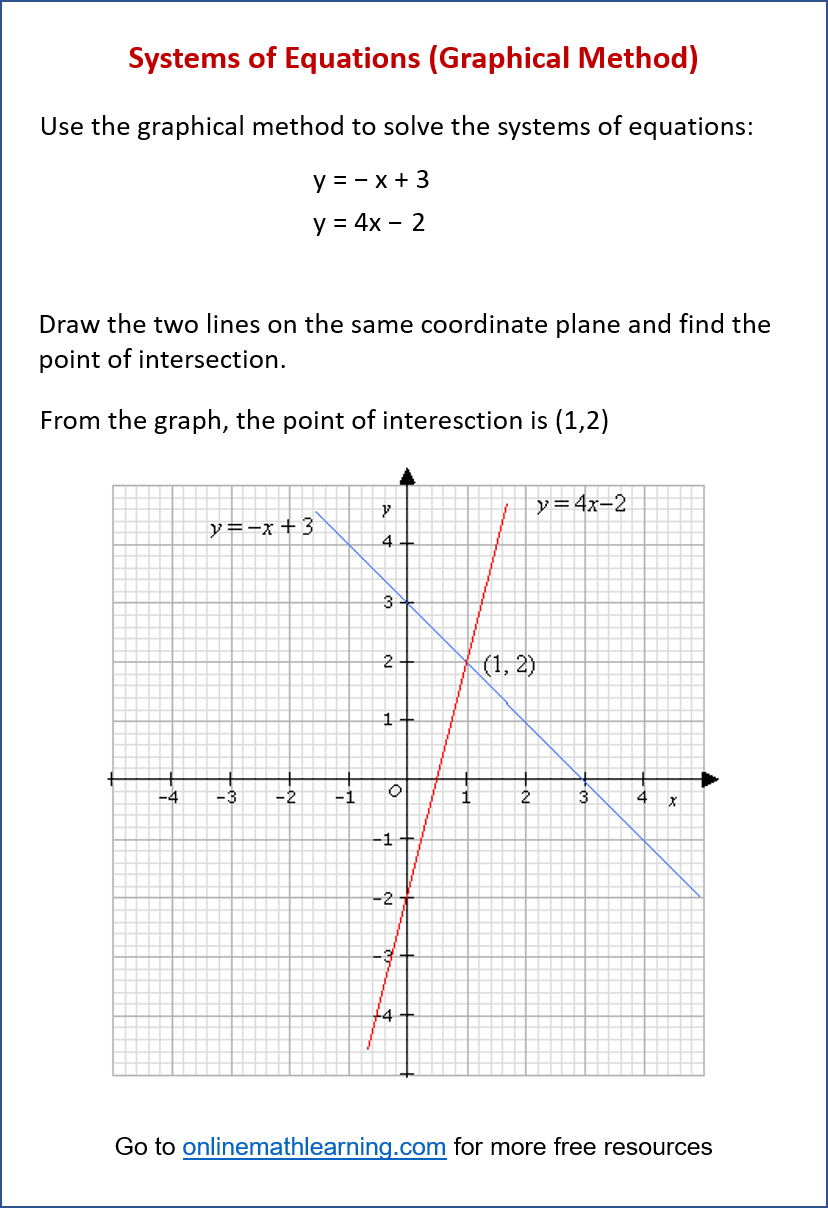
A system of equations is a set of two or more equations with the same variables. To solve systems of equations or simultaneous equations by the graphical method, we draw the graphs for each of the equation on a coordinate plane and look for a point of intersection between the graphs. The coordinates of the point of intersection would be the solution to the system of equations.
The following diagram shows how to find the solution of a systems of equations using the graphical method.

Algebra Worksheets
Practice your skills with the following worksheets:
Printable & Online Algebra Worksheets
Steps to Solve a System of Equations by Graphing:
- Rewrite the equations in slope-intercept form (y = mx + b):
This makes it easier to identify the slope (m) and y-intercept (b) of each line, which are needed for graphing. - Graph both equations on the same coordinate plane:
You can do this by:
Plotting the y-intercept (b) as the first point.
Using the slope (m) to find other points. Remember that slope is rise over run.
Connecting the points to draw each line. - Identify the intersection point:
The point where the two lines cross is the solution to the system of equations.
Read the coordinates of this point (x, y). - Check the solution:
Substitute the x and y values from the intersection point back into both original equations.
If the values satisfy both equations, then it is the correct solution.
Possible Outcomes:
- One intersection point: The system has one unique solution.
- Parallel lines: The lines never intersect, meaning the system has no solution.
- Same line: The lines overlap completely, meaning the system has infinitely many solutions.
The Graphical Method provides a visual understanding of the solution and the relationship between the equations. However, it can be less precise than algebraic methods (like substitution or elimination) if the intersection point involves fractions or decimals that are hard to read accurately from a graph.
Videos
How to Solve Systems of Equations Graphically?
A system of equations is a set of two or more equations that are to be solved simultaneously.
A solution of a system of two equations in two variables is an ordered pair of numbers that makes both equations true. The numbers in the ordered pair correspond to the variables in alphabetical order.
What can happen when two lines are graphed on the same coordinate plane?
- The graphs intersect at one point. The system is consistent and has one solution. Since neither equation is a multiple of the other, they are independent.
- The graphs are parallel. The system is inconsistent because there is no solution. Since the equations are not equivalent, they are independent.
- Equations have the same graph. The system is consistent and has an infinite number of solutions. The equations are dependent since they are equivalent.
Examples:
-
Solve this system of equations by graphing:
y = 3x + 1
x - 2y = 3 -
Solve this system of equations by graphing:
y - x = 5
2x - 2y = 10 -
Solve this system of equations by graphing:
y = 3x + 1
x - 2y = 3 -
Solve this system of equations by graphing:
y = -x + 3
2x - 2y = 10
How to solve systems of equations using the graphical method?
Systems of equations with one solution, no solutions (inconsistent system) and infinite solutions (dependent systems)
Examples:
-
Solve
x + y = 1
x - y = -5 -
Solve
y = 2x -4
y = -1/2 x + 1 -
Solve
2x + 3y = 6
y = -2/3 x - 2
Solving a Linear System of Equations by Graphing
The basic idea is to graph the two lines and look for any points of intersection.
Examples:
Solve
5x - y = 6
2x + y = 8
Advantages of the Graphical Method:
Provides a visual representation of the solution.
Easy to understand the concept of a solution as the intersection of lines.
Disadvantages of the Graphical Method:
Can be inaccurate if the intersection point has non-integer coordinates.
Not practical for systems with more than two variables.
Systems of Equations Calculator
We have included a systems of equations calculator that can solve systems of equations graphically and algebraically. Use it to check your answers.
This math tool will determine the intersection point of two lines or curves. Enter in the two equations and submit. The graphs of the two equations will be shown. Select step-by-step solution if you want to see the equations solved algebraically.
Try out our new and fun Fraction Concoction Game.
Add and subtract fractions to make exciting fraction concoctions following a recipe. There are four levels of difficulty: Easy, medium, hard and insane. Practice the basics of fraction addition and subtraction or challenge yourself with the insane level.

We welcome your feedback, comments and questions about this site or page. Please submit your feedback or enquiries via our Feedback page.