Illustrative Mathematics Unit 6.6, Lesson 1: Tape Diagrams and Equations
Learning Targets:
- I can tell whether or not an equation could represent a tape diagram.
- I can use a tape diagram to represent a situation.
Related Pages
Illustrative Math
Grade 6
Lesson 1: Tape Diagrams and Equations
Let’s see how tape diagrams and equations can show relationships between amounts.
Illustrative Math Unit 6.6, Lesson 1 (printable worksheets)
Lesson 1 Summary
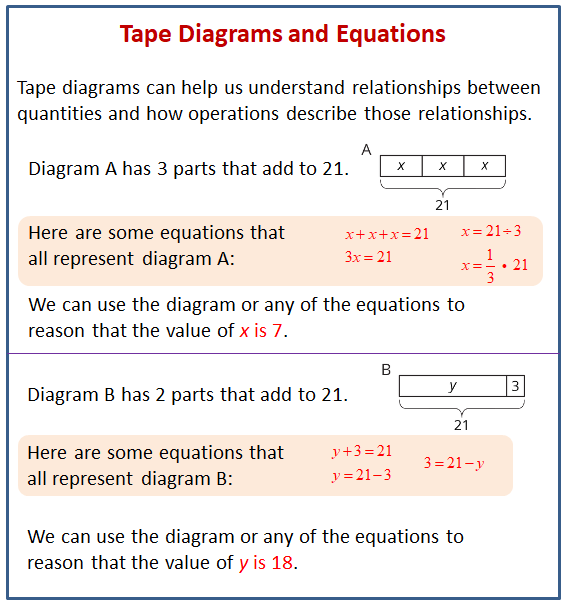
The following diagram shows how to relate tape diagrams and equations.

Lesson 1.1 Which Diagram is Which?
Here are two diagrams. One represents 2 + 5 = 7. The other represents 5 · 2 = 10. Which is which? Label the length of each diagram.
Draw a diagram that represents each equation.
- 4 + 4 = 7
- 4 · 3 = 12
Scroll down the page for the solutions to the “Are you ready for more?” section.
Lesson 1.2 Match Equations and Tape Diagrams
Here are two tape diagrams. Match each equation to one of the tape diagrams.
- 4 + x = 12
- 12 ÷ 4 = x
- 4 · x = 12
- 12 = 4 + x
- 12 - x = 4
- 12 = 4 · x
- 12 - 4 = x
- x = 12 -4
- x + x + x + x = 12
Lesson 1.3 Draw Diagrams for Equations
For each equation, draw a diagram and find the value of the unknown that makes the equation true.
- 18 = 3 + x
- 18 = 3 · y
Are you ready for more?
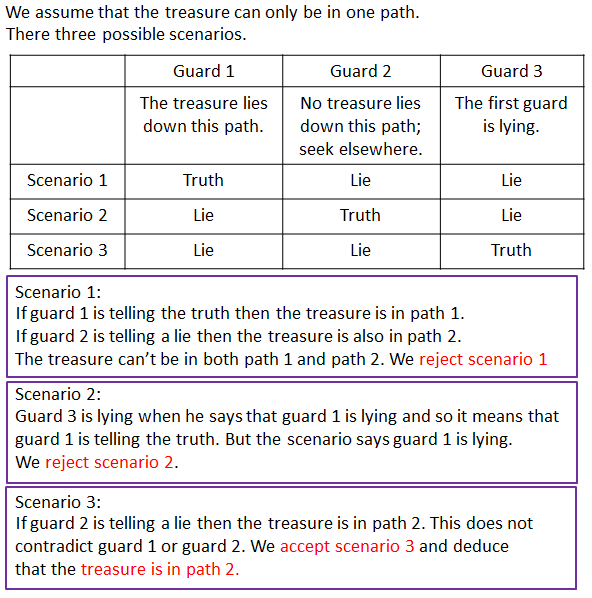
You are walking down a road, seeking treasure. The road branches off into three paths. A guard stands in each path. You know that only one of the guards is telling the truth, and the other two are lying. Here is what they say:
- Guard 1: The treasure lies down this path.
- Guard 2: No treasure lies down this path; seek elsewhere.
- Guard 3: The first guard is lying.
Which path leads to the treasure?
Lesson 1 Practice Problems
- Here is an equation: x + 4 = 17
a. Draw a tape diagram to represent the equation.
b. Which part of the diagram shows the quantity x? What about 4? What about 17?
c. How does the diagram show that x + 4 has the same value as 17? - Diego is trying to find the value of x in 5 · x = 35. He draws this diagram but is not certain how to proceed.
a. Complete the tape diagram so it represents the equation 5 · x = 35.
b. Find the value of x. - For each equation, draw a tape diagram and find the unknown value.
a. x + 9 = 16
b. 4 · x = 28 - Match each equation to one of the two tape diagrams.
a. x + 3 = 9
b. 3 · x = 9
c. 9 = 3 · x
d. 3 + x = 9
e. x = 9 - 3
f. x = 9 ÷ 3
g. x + x + x = 9 - A shopper paid $2.52 for 4.5 pounds of potatoes, $7.75 for 2.5 pounds of broccoli, and $2.45 for 2.5 pounds of pears. What is the unit price of each item she bought? Show your reasoning.
The Open Up Resources math curriculum is free to download from the Open Up Resources website and is also available from Illustrative Mathematics.
Try out our new and fun Fraction Concoction Game.
Add and subtract fractions to make exciting fraction concoctions following a recipe. There are four levels of difficulty: Easy, medium, hard and insane. Practice the basics of fraction addition and subtraction or challenge yourself with the insane level.

We welcome your feedback, comments and questions about this site or page. Please submit your feedback or enquiries via our Feedback page.
