Sine, Cosine, Tangent Graphs
In these lessons, we will look at the graphs of the trigonometric functions: sine, cosine and tangent and how to determine the domain, range, and period of the sine, cosine, and tangent functions.
Related Pages
Trigonometric Graphs
Lessons On Trigonometry
Trigonometric Functions
Properties Of The Sine Graph

- The sine function forms a wave that starts from the origin.
- sin θ = 0 when θ = 0˚, 180˚, 360˚, …
- Maximum value of sin θ is 1 when θ = 90 ˚. Minimum value of sin θ is –1 when θ = 270 ˚. So, the range of values of sin θ is –1 ≤ sin θ ≤ 1.
- As the point P moves round the unit circle in either the clockwise or anticlockwise direction, the sine curve above repeats itself for every interval of 360˚. The interval over which the sine wave repeats itself is called the period.
Properties Of The Cosine Graph

- The cosine function forms a wave that starts from the point (0,1)
- cos θ = 0 when θ = 90˚, 270˚, …
- Maximum value of cos θ is 1 when θ = 0˚, 360˚. Minimum value of cos θ is –1 when θ = 180 ˚. So, the range of values of cos θ is – 1 ≤ cos θ ≤ 1.
- As the point P moves round the unit circle in either the clockwise or anticlockwise direction, the cosine curve above repeats itself for every interval of 360˚. Its period is 360˚.
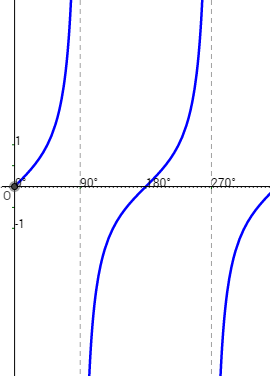
Properties Of The Tangent Graph

- The tangent curve is not continuous. It breaks at θ = 90˚ and 270˚, where the function is undefined.
- tan θ = 0 when θ = 0˚, 180˚, 360˚.
- tan θ = 1 when θ = 45˚ and 225˚.
- tan θ = –1 when θ = 135˚ and 315˚.
- tan θ does not have any maximum or minimum values. The range of values of tan θ is – ∞ < tan θ < ∞
- As the point P moves round the unit circle in either the clockwise or anticlockwise direction, the tangent curve above repeats itself for every interval of 180˚. Its period is 180˚.
Properties of the sine graph, cosine graph and tangent graph
You may want to look at the lesson on unit circle, if you need revision on the unit circle definition of the trigonometric functions.
Graphs of the trig functions
A demonstration of the sine graph, cosine graph and tangent graph.
How to Graph the Sine and Cosine Functions?
Graph the Sine and Cosine functions on the coordinate plane using the unit circle.
Determine the domain and range of the sine and cosine functions.
Determine the period of the sine and cosine functions.
Graph the Tangent function and identify key properties of the function
Graph the Tangent function on the coordinate plane using the unit circle.
Determine the domain and range of the Tangent function.
Determine the period of the Tangent function.
Graphs of transformed sin and cos functions
This lesson shows examples of graphing transformed y = sin x and y = cos x graphs (including changes in period, amplitude, and both vertical & horizontal translations). There is also an example of how to graph y = tan x using the y = sin x and y = cos x functions.
Examples:
- Graph y = 3sin2x
- Graph y = 4cos 1/2 x - 2
- Graph y = -3sin4(x - π/6) + 1
- Graph y = tan x
Try the free Mathway calculator and
problem solver below to practice various math topics. Try the given examples, or type in your own
problem and check your answer with the step-by-step explanations.

We welcome your feedback, comments and questions about this site or page. Please submit your feedback or enquiries via our Feedback page.