Two-Way Tables Worksheets
Related Topics:
More Math Worksheets
More Printable Math Worksheets
More Grade 7 Math Lessons
Grade 8 Math Worksheets
Printable “Statistics” worksheets:
Statistical Questions
Categorical vs. Numerical Data
Create Dot Plots
Interpret Dot Plots
Histograms
Relative Frequency Histograms
Scatter Plots
Two-Way Tables
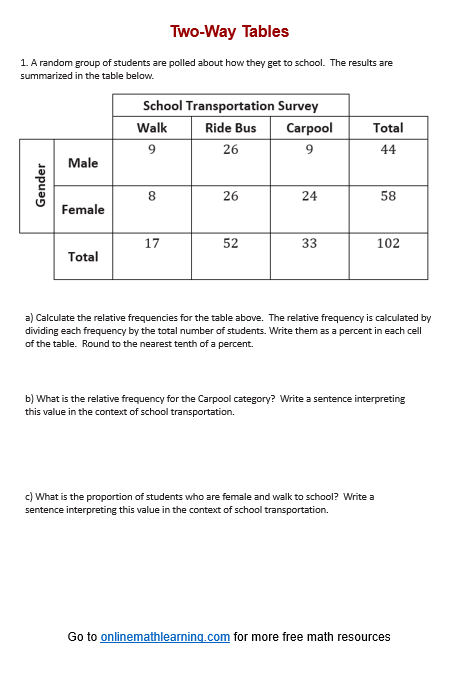
Examples, solutions, videos, and worksheets to help Grade 7 and Grade 8 students learn to organize bivariate categorical data into a two-way table. Calculate row and column relative frequencies and interpret them in context.
Two-Way Tables
A two-way table, also known as a contingency table or cross-tabulation, is a tool used in statistics to display the relationship between two categorical variables (or bivariate categorical data). It organizes the data into rows and columns, allowing you to see how often combinations of these categories occur.
Structure of a Two-Way Table:
Rows: Represent the categories of one variable.
Columns: Represent the categories of the second variable.
Cells: Contain the counts or frequencies of the combinations of the row and column categories.
Margins: The totals for each row and column, often added to give a complete picture of the dataset.
- Univariate categorical data are displayed in a one-way frequency table.
- Bivariate categorical data are displayed in a two-way frequency table.
- Relative frequency is the frequency divided by a total.
- A cell relative frequency is a cell frequency divided by the total number of observations.
- A row relative frequency is a cell frequency divided by the row total.
- A column relative frequency is a cell frequency divided by the column total.
Have a look at this video if you need to review Two-Way Tables.
Click on the following worksheet to get a printable pdf document.
Scroll down the page for more Two-Way Tables Worksheets.
More Two-Way Tables Worksheets
Printable
(Answers on the second page.)
Two-Way Tables Worksheet #1
Two-Way Tables Worksheet #2
Two-Way Tables Worksheet #3
Related Lessons & Worksheets
Two-Way Tables
More Printable Worksheets
Try the free Mathway calculator and
problem solver below to practice various math topics. Try the given examples, or type in your own
problem and check your answer with the step-by-step explanations.

We welcome your feedback, comments and questions about this site or page. Please submit your feedback or enquiries via our Feedback page.
