Illustrative Mathematics Grade 8, Unit 3, Lesson 1: Understanding Proportional Relationships
Learning Targets:
- I can graph a proportional relationship from a story.
- I can use the constant of proportionality to compare the pace of different animals.
Related Pages
Illustrative Math
Grade 8
Lesson 1: Understanding Proportional Relationships
Let’s study some graphs.
Illustrative Math Unit 8.3, Lesson 1 (printable worksheets)
Lesson 1 Summary
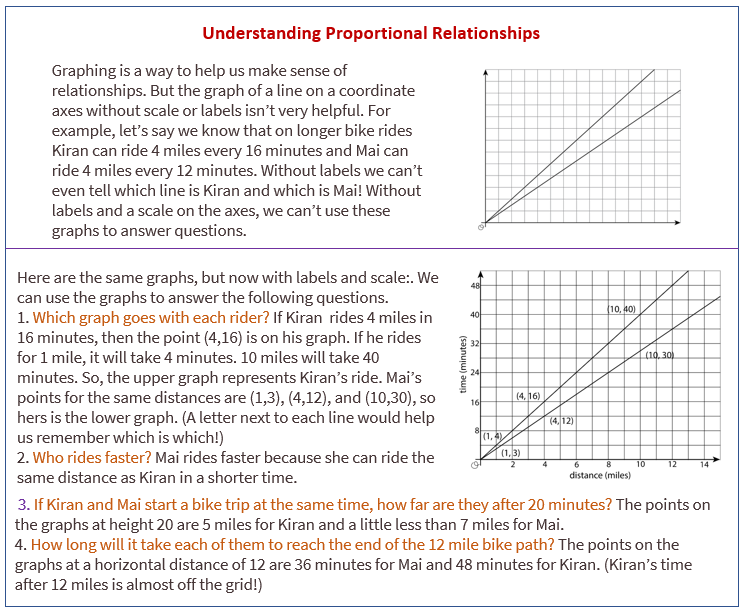
The following diagram shows how to graph a proportional relationship from a story.

Lesson 1.1 Notice and Wonder: Two Graphs
What do you notice? What do you wonder?
Lesson 1.2 Moving Through Representations
A ladybug and ant move at constant speeds. The diagrams with tick marks show their positions at different times. Each tick mark represents 1 centimeter.
- Lines u and v also show the positions of the two bugs. Which line shows the ladybug’s movement? Which line shows the ant’s movement? Explain your reasoning.
- How long does it take the ladybug to travel 12 cm? The ant?
- Scale the vertical and horizontal axes by labeling each grid line with a number. You will need to use the time and distance information shown in the tick-mark diagrams.
- Mark and label the point on line u and the point on line v that represent the time and position of each bug after traveling 1 cm.
Are you ready for more?
- How fast is each bug traveling?
- Will there ever be a time when the purple bug (ant) is twice as far away from the start as the red bug (ladybug)? Explain or show your reasoning.
Lesson 1.3 Moving Twice as Fast
Refer to the tick-mark diagrams and graph in the earlier activity when needed.
- Imagine a bug that is moving twice as fast as the ladybug. On each tick-mark diagram, mark the position of this bug.
- Plot this bug’s positions on the coordinate axes with lines u and v, and connect them with a line.
- Write an equation for each of the three lines.
Lesson 1 Practice Problems
- Priya jogs at a constant speed. The relationship between her distance and time is shown on the graph. Diego bikes at a constant speed twice as fast as Priya. Sketch a graph showing the relationship between Diego’s distance and time.
- A you-pick blueberry farm offers 6 lbs of blueberries for $16.50. Sketch a graph of the relationship between cost and pounds of blueberries.
- A line contains the points (-4,1) and (4,6). Decide whether or not each of these points is also on the line:
- The points (2,-4),(x,y), A, and B all lie on the line. Find an equation relating x and y.
The Open Up Resources math curriculum is free to download from the Open Up Resources website and is also available from Illustrative Mathematics.
Try the free Mathway calculator and
problem solver below to practice various math topics. Try the given examples, or type in your own
problem and check your answer with the step-by-step explanations.

We welcome your feedback, comments and questions about this site or page. Please submit your feedback or enquiries via our Feedback page.