Set Theory: Venn Diagrams And Subsets
Related Pages
Union Of Sets
Intersection Of Two Sets
Intersection Of Three Sets
More Lessons On Sets
More Lessons for GCSE Maths
Math Worksheets
| Free Roman Numeral Games | ||
|---|---|---|
| Set Operations & Venn Diagrams | Venn Diagram Examples | Set Worksheets |
What Is A Venn Diagram?
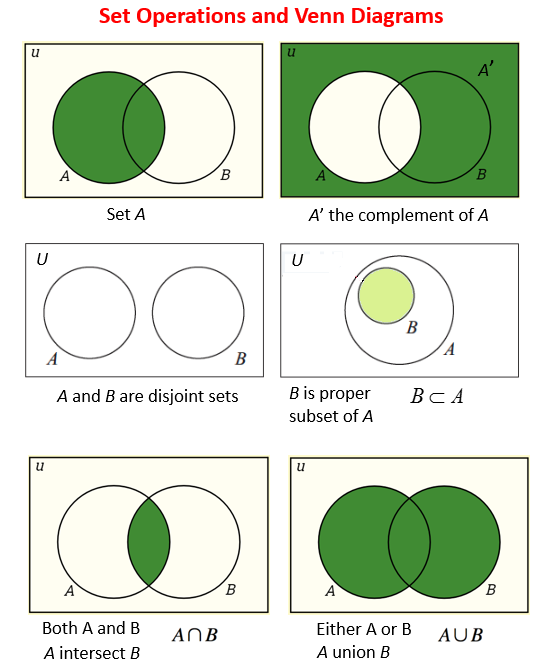
A Venn Diagram is a pictorial representation of the relationships between sets.
We can represent sets using Venn diagrams. In a Venn diagram, the sets are represented by shapes; usually circles or ovals. The elements of a set are labeled within the circle.
The following diagrams show the set operations and Venn Diagrams for Complement of a Set, Disjoint Sets, Subsets, Intersection and Union of Sets. Scroll down the page for more examples and solutions.

The set of all elements being considered is called the Universal Set (U) and is represented by a rectangle.
- The complement of A, A’, is the set of elements in U but not in A. A’ ={x | x ∈ U and x ∉ A}. The area outside the circle but inside the rectangle represents the complement of A.
- Sets A and B are disjoint sets if they do not share any common elements. Their intersection is an empty set (A ∩ B = ∅). The two circle A and B do not overlap, indicating no common elements.
- B is a proper subset of A. This means B is a subset of A, but B ≠ A. The smaller circle, B, is entirely contained within the larger circle, A.
- The intersection of A and B is the set of elements in both set A and set B. A ∩ B = {x | x ∈ A and x ∈ B}. The two circles overlap. The overlapping region represents A ∩ B.
- The union of A and B is the set of elements in set A or set B. A ∪ B = {x | x ∈ A or x ∈ B}. The entire area covered by both circles represents A ∪ B.
- A ∩ ∅ = ∅
- A ∪ ∅ = A
Set Operations And Venn Diagrams
Example:
1. Create a Venn Diagram to show the relationship among the sets.
U is the set of whole numbers from 1 to 15.
A is the set of multiples of 3.
B is the set of primes.
C is the set of odd numbers.
2. Given the following Venn Diagram determine each of the following set.
a) A ∩ B
b) A ∪ B
c) (A ∪ B)’
d) A’ ∩ B
e) A ∪ B'
Venn Diagram Examples
Example:
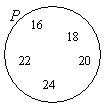
Given the set P is the set of even numbers between 15 and 25. Draw and label a Venn diagram to
represent the set P and indicate all the elements of set P in the Venn diagram.
Solution:
List out the elements of P.
P = {16, 18, 20, 22, 24} ← ‘between’ does not include 15 and 25
Draw a circle or oval. Label it P. Put the elements in P.

Example:
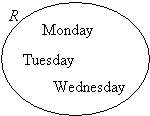
Draw and label a Venn diagram to represent the set
R = {Monday, Tuesday, Wednesday}.
Solution:
Draw a circle or oval. Label it R . Put the elements in R.

Example:
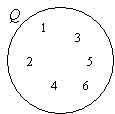
Given the set Q = { x : 2x – 3 < 11, x is a positive integer }. Draw and label a Venn diagram to
represent the set Q.
Solution:
Since an equation is given, we need to first solve for x.
2x – 3 < 11 ⇒ 2x < 14 ⇒ x < 7

So, Q = {1, 2, 3, 4, 5, 6}
Draw a circle or oval. Label it Q.
Put the elements in Q.
Venn Diagram Videos
What’s a Venn Diagram, and What Does Intersection and Union Mean?
Venn Diagram and Subsets
Learn about Venn diagrams and subsets.
Try the free Mathway calculator and
problem solver below to practice various math topics. Try the given examples, or type in your own
problem and check your answer with the step-by-step explanations.

We welcome your feedback, comments and questions about this site or page. Please submit your feedback or enquiries via our Feedback page.